Importance of Analytics Strategy
Product managers are riddled with buzzwords, metrics, and frameworks that overwhelm attempts to understand their users and make better products for them. However, strip away the jargon, and the problem that every product manager is trying to solve today becomes very clear; that is: to build products that customers find valuable. Thus, the foundation of any product analytics strategy is essentially, to measure a product’s value against a user’s desire to exchange something for it.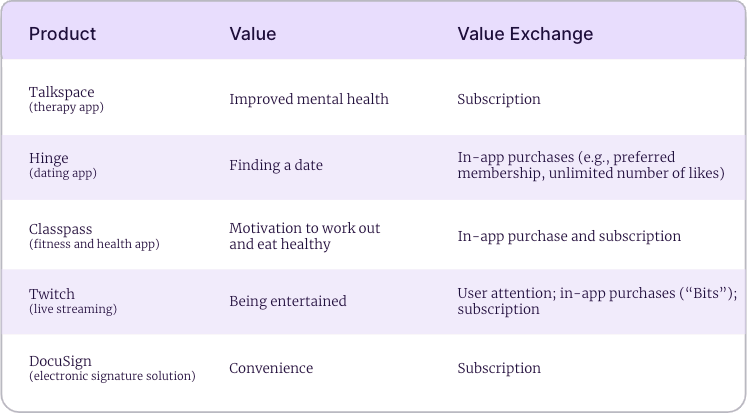
The RAE Framework
For customers new to product analytics, we’d like to recommend a simple RAE framework to hone in on your 2-3 key metrics / KPIs. RAE stands for Reach, Activation, and Engagement. Using this framework, you can quickly identify the key events and properties you need to start measuring your KPIs. This framework also translates into a clearly defined funnel or sequence of events that monitors your product’s reach, to enabling user activation, and finally tracking the level of your users’ engagement.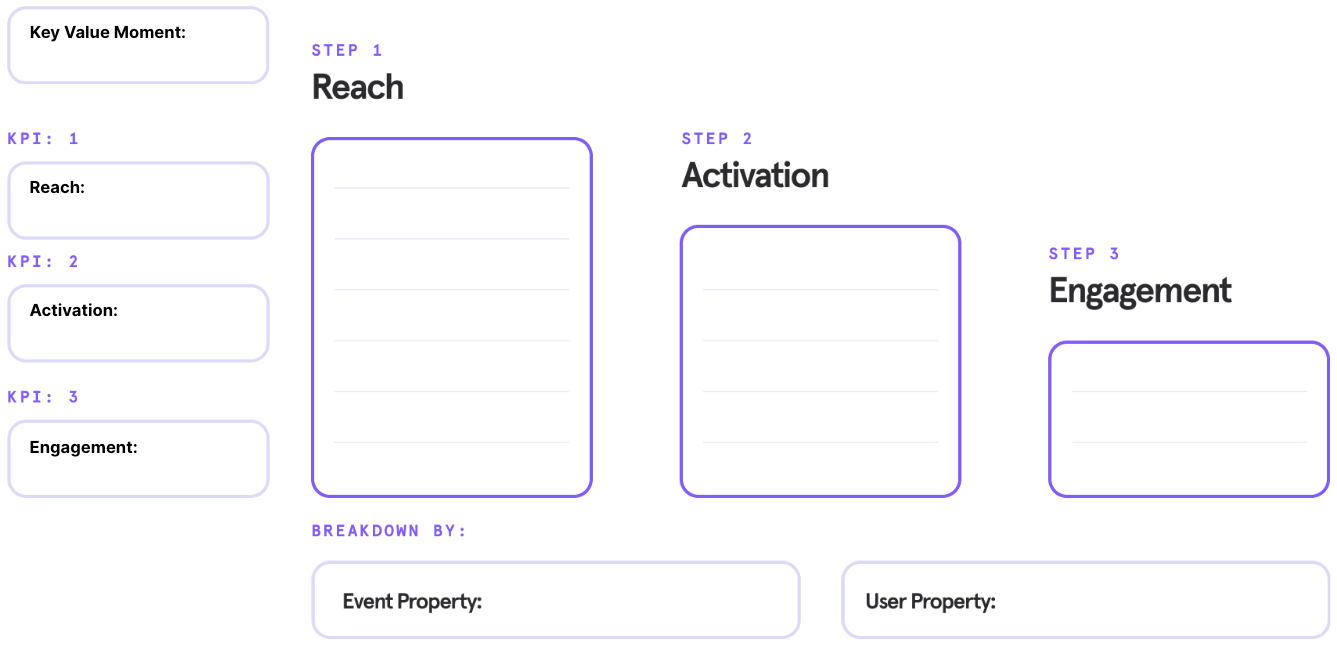
Measure your Product’s Value
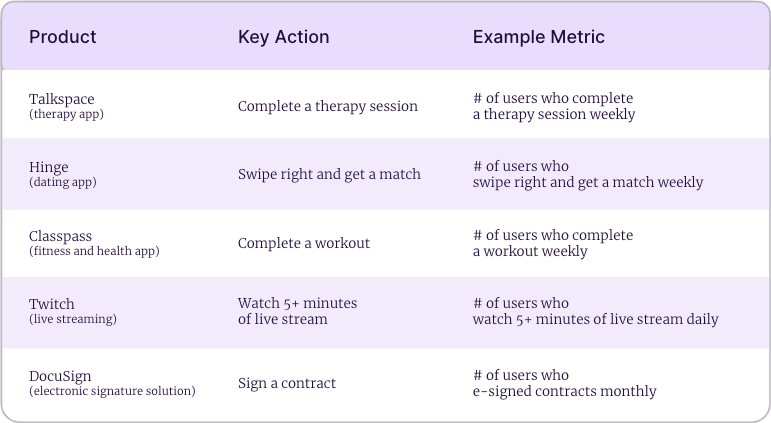
Your product’s metrics and KPIs should be defined around your product’s value to your target users. The more value your users derive from your product, the higher their adoption and engagement which leads to higher retention.- Identify the key actions that indicate a user is getting value out of your product
- Match these key actions to their expected natural frequency (daily / weekly / monthly) at solving your user’s problem
Retain your Product’s Reach
Reach is defined as the total number of users who have used your product in a recent time period.- For consumer companies, it could be the number of paid accounts, or users who have made purchases in the past three months.
- For B2B companies, this key metric is often product install base or number of paid licenses within the past quarter or year.
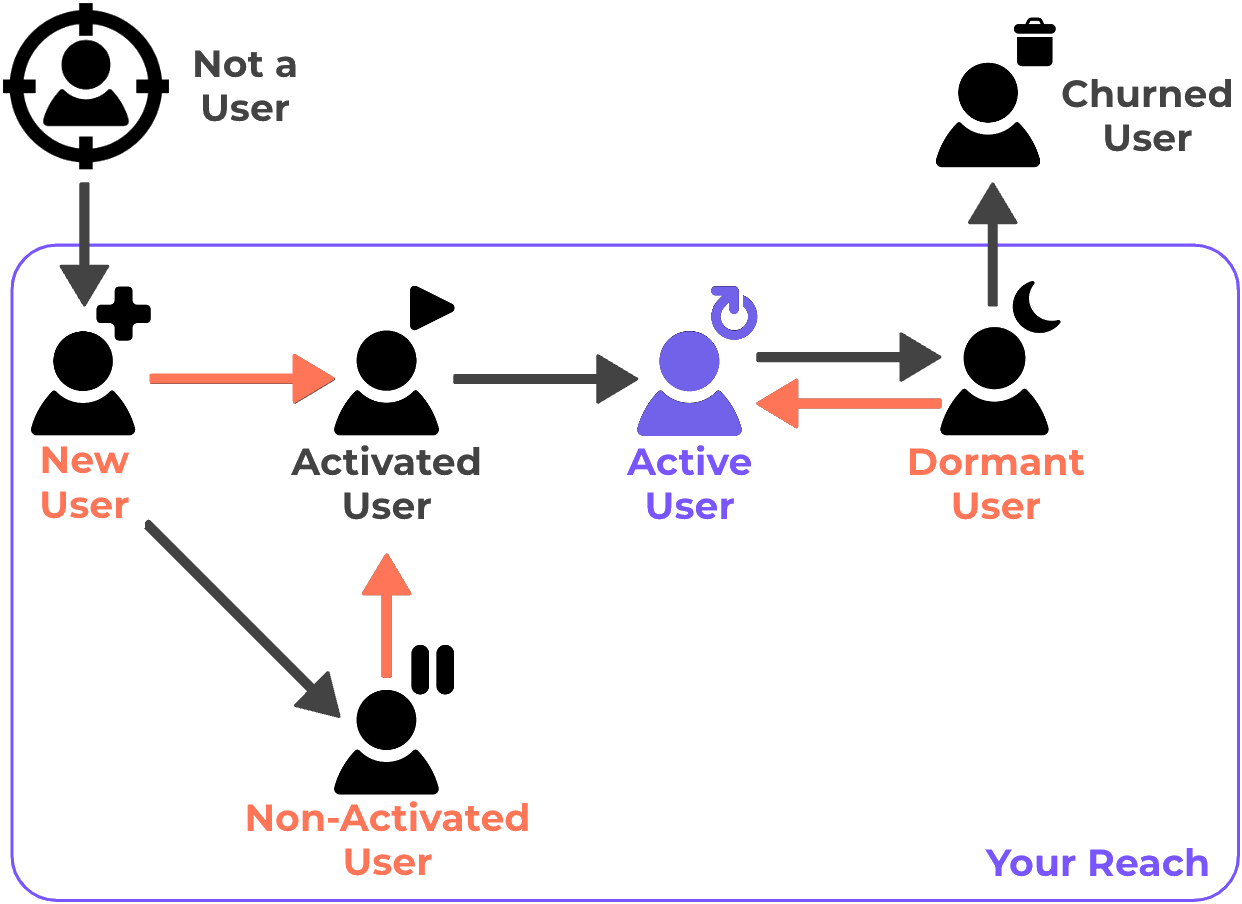
- Rate of activating your New Users - getting them to value as quickly as possible
- Percentage of Non-Activated to Activated Users - eliminating the barriers causing non-activation
- Percentage of Dormant to Active Users - resurrecting users who have gone dormant
Activate your Users
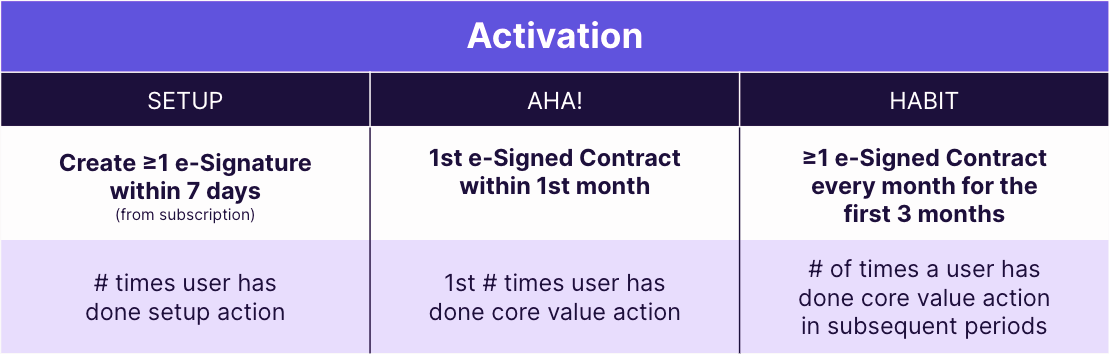
User Activation is not simply about a user creating their account or signing-up to your product. It is the process of taking a user from sign-up to establishing a habit around your product’s core value proposition. The user’s first impression of your product will influence their every following step, including further engagement and upgrades, so it is essential to understand and optimize for this journey.- Setup - defined as the number of times the user has done the setup action within the initial time period from sign-up. Think about the absolute must have “setup” action or information that you need from your user to be able for them to start discovering your product’s core value proposition.
- Aha! - defined as the first number of times the user has done the core value action within the initial time period. This is the critical “aha!” moment where you show the user your product’s core value proposition for the first time; and they are deciding if your product solves their needs or problem.
- Habit - defined as the number of times the user has done the core value action for every time period within the initial window. Once your user understands your product’s core value proposition, you would need to let them re-experience that same core value and reinforce their continuous usage of your product. Essentially forming a “habit” of being an active user.
Increase User Engagement
Engagement measures the depth of user activity in discovering or experiencing more value moments from your product. Highly engaged users are more likely to contribute to stronger product growth, as they not only contribute to more “value exchange”, but are also more likely to recommend your product.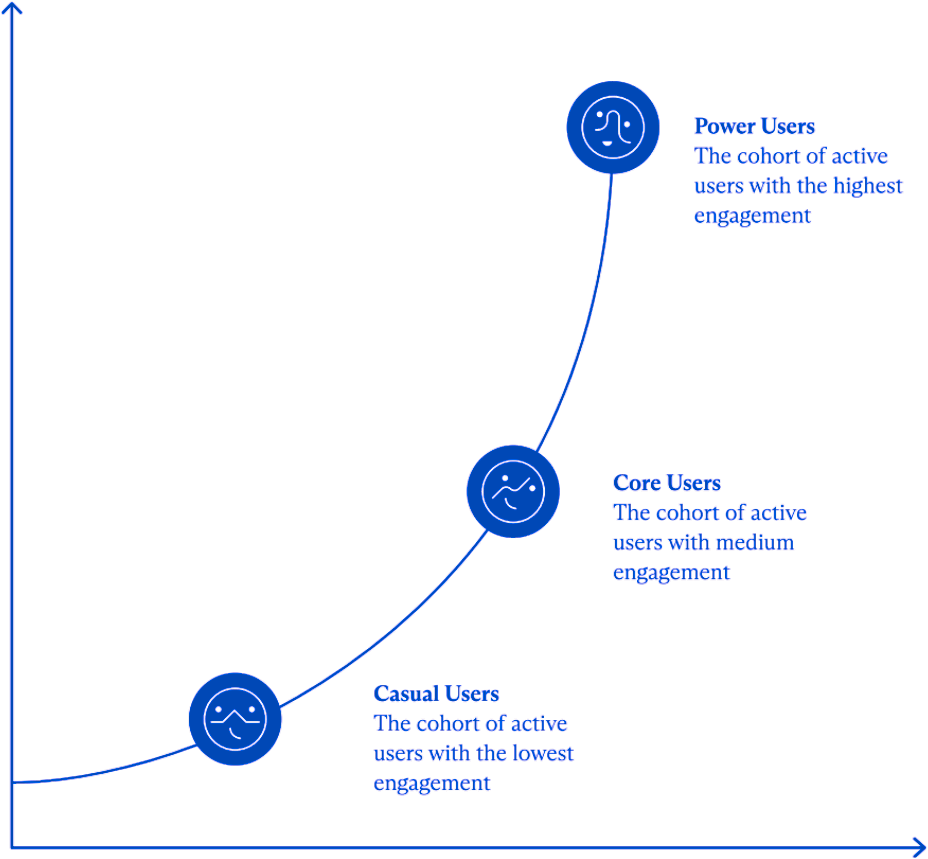
- Adding use cases - moving users to adopt additional product use cases (Example: Uber rides to Uber Eats)
- Increasing feature usage - increasing the percentage of product feature usage (Example: search filters, recommendations, match alerts)
- Increasing usage frequency - increasing the frequency of product usage (Example: from 1 value action to 3 value actions in 7 days)
- Increasing intensity - increasing the intensity (spend, time, actions) of each product usage (Example: spending more time playing a game or more money during cart checkouts)
Crafting your Metrics and KPIs
Regardless of the Analytics Framework you adopt, it’s important to craft your metrics and KPIs based on your business’ goals, ensuring they are not only result-oriented, but also actionable. Leverage the following key pointers as you define your metrics and KPIs:- Meaningful: aligns with your organization’s vision, mission and strategy, based on your product’s value moments, easy to understand
- Measurable: can be quantified, tracked, calculated, and assessed
- Manageable: within your product’s influence or control, realistic, pragmatic
- Movable: can be improved through targeted initiatives, action-oriented
- Time bound: trackable within a defined limited period of time, not open-ended
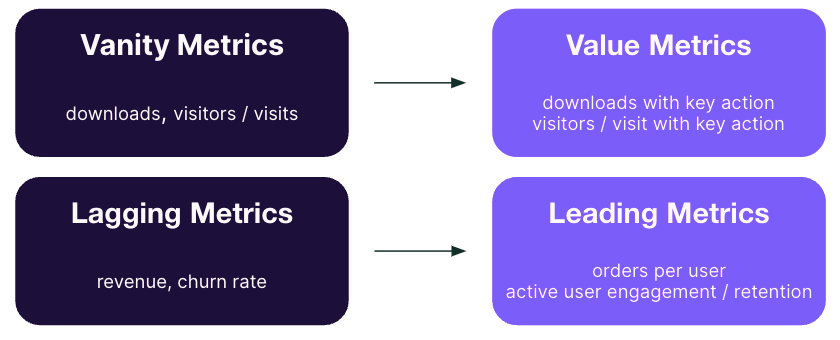
- Vanity Metrics: doesn’t help you understand your product performance that informs future strategies; instead, focus on Value Metrics that measure how your target users perceive value to effect “value exchange” (see How Viber shifted from vanity to value metrics)
- Lagging Metrics: after-the-fact measured outcomes that are no longer actionable (example: revenue, churn); instead, focus on Leading Metrics that help you anticipate and predict what will happen so you can be more tactical in course-correcting (more details on looking at Leading and Lagging Indicators to Measure Product Progress)
Summary
As your product evolves so should your metrics and KPIs. Depending on your key value moment’s natural frequency, business objectives, and product maturity, you should be reviewing your metrics periodically (eg: every 3, 6, or 12 months) to see if they are still relevant in driving product and business growth. To sum up everything you’ve learned, below is an example of the RAE Framework (click to zoom). You can also access a copy of a blank RAE Framework Template from here. Save a copy to your device to get started on defining your metrics and KPIs.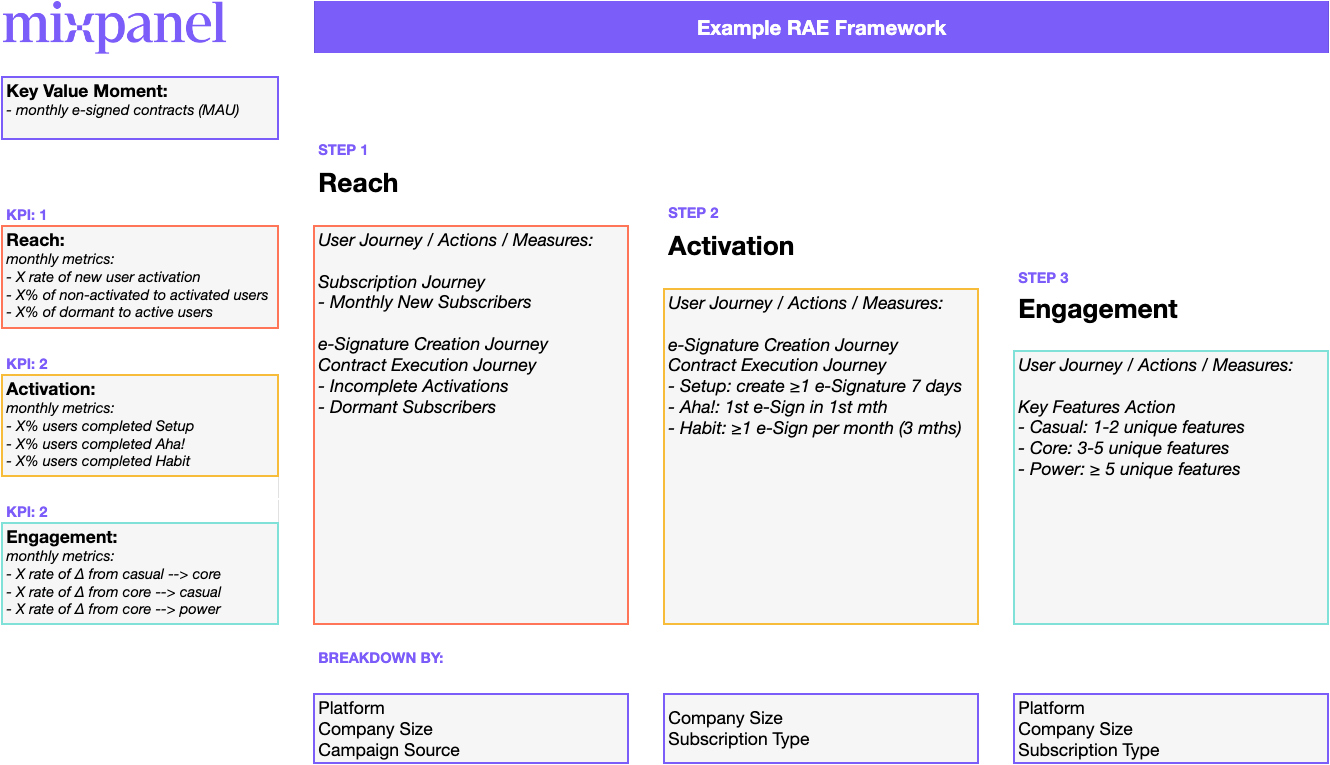 💡 Start thinking about Retention once you have fine-tuned your RAE Framework.