- US Users: Users who are from the US
- New Users: Users who signed up in the past month
- Power Users: Users who used your app on 5 out of the last 7 days
- Dropped-Off Users: Users who signed up, but did not come back the following week
Creating Cohorts
You can create cohorts via any of our report visualizations or explicitly using the cohort builder.Creating a Cohort via a Report
Click any bar or point in an Insights, Funnels, or Retention report and select “View Users”. The side panel will show the list of users that belong to that bar or point you selected. You can save that group of users as a cohort.Creating a Cohort via the Cohort Builder
The Cohort Builder lets you define cohorts based on a precise set of conditions. These conditions are either of the form “Users who did<event> more/less than <some threshold>” or “Users where <profile property> is equal to/more/less than <value>”. You can save these conditions as the definition for your Cohort.
Below are a few examples:
Filter by users who watched more than 10 videos in the last 7 days
Note on cohorts whose filters contain user properties
Because user profile properties only store the most recent value, cohorts involving user profile properties will use the current value for those properties (even if the value changed over time). For example, suppose the cohort’s filter criteria is: users where user[“City”] == “SF” and “Did Event: Order Ride 3 times in Last 7 days”. Mixpanel computes the above over the last 30 days and then groups the set of users who have property user[“City”] == “SF” as of right now and intersect that with the daily cohort of users who did Order Ride 3 times in the last 7 days.Creating a Cohort via Lexicon
Cohorts can also be created and managed in Lexicon. In Lexicon, you can see all your saved cohorts alongside your other saved definitions like metrics, custom events, and custom properties.Creating a Cohort with Changing User Properties
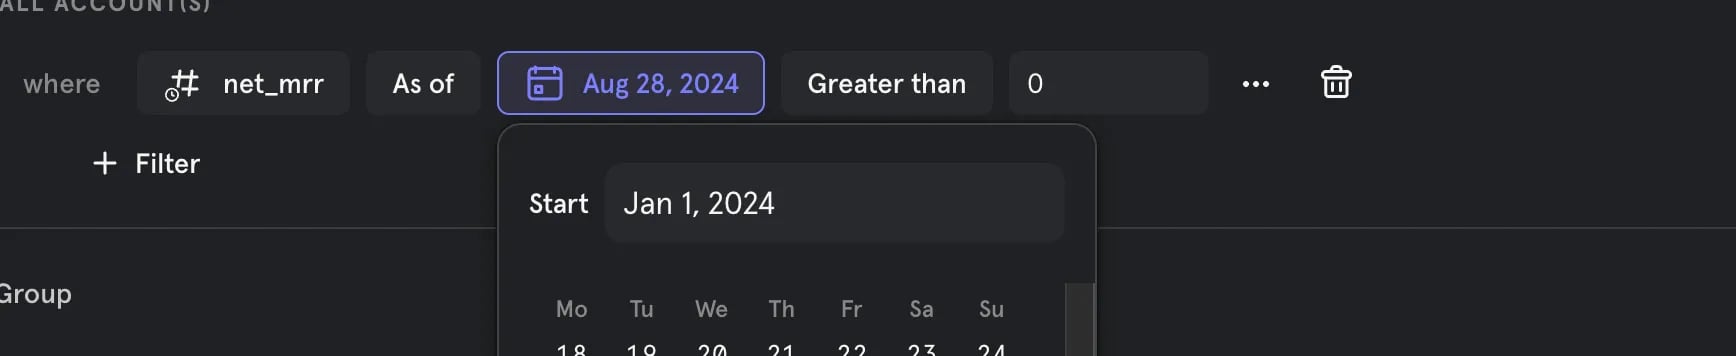
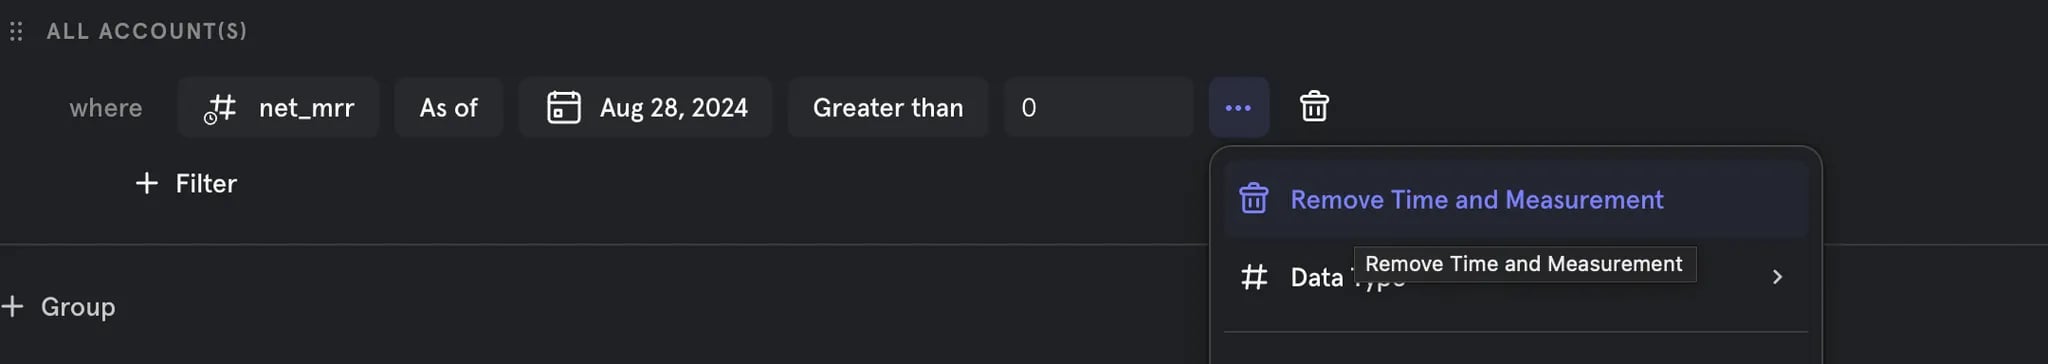
With historical user or group properties, you can optionally Add Time and Measurement to specify the time-range over which to search for the property value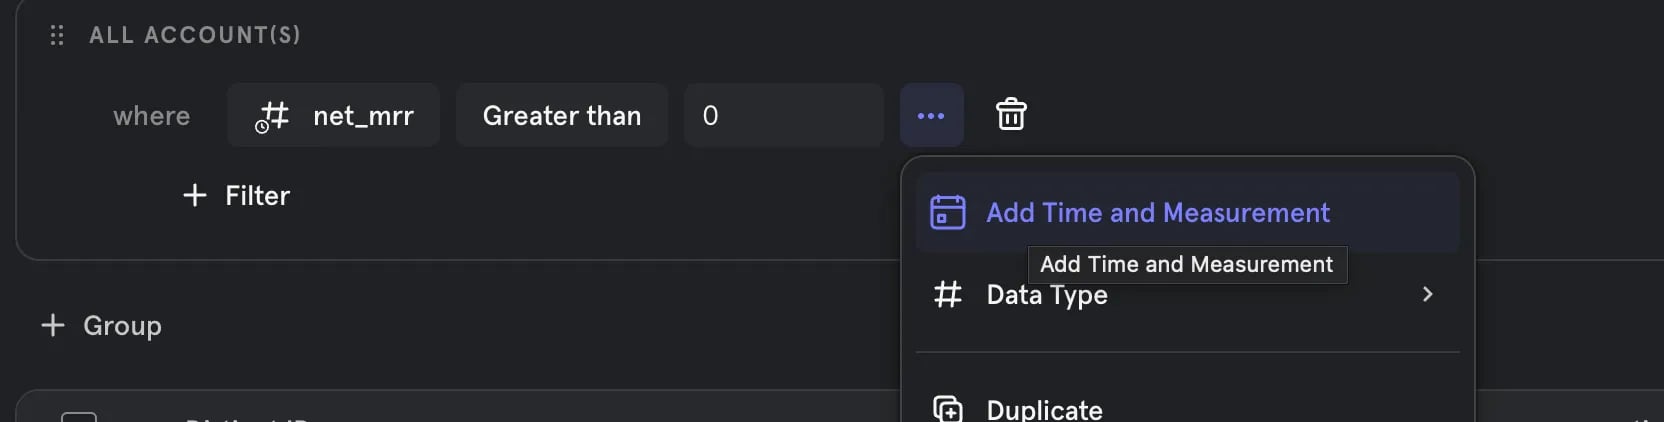
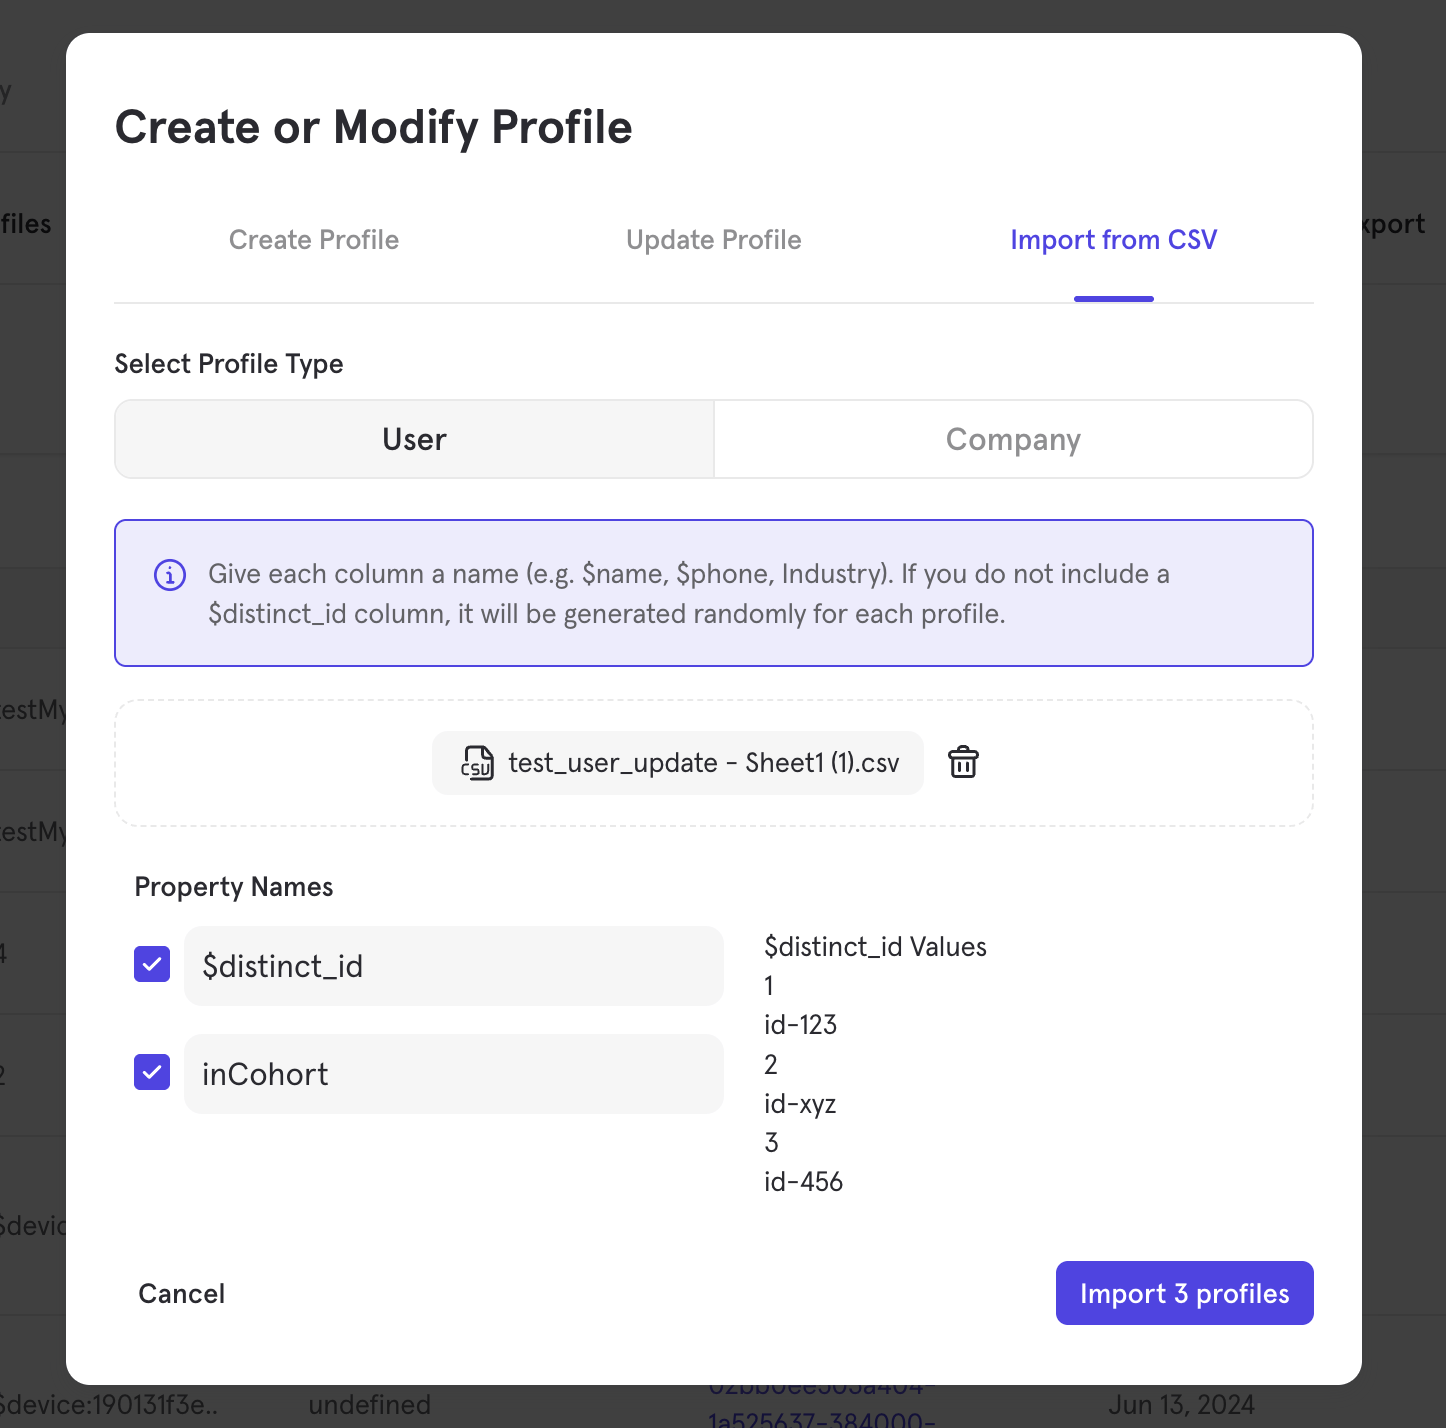
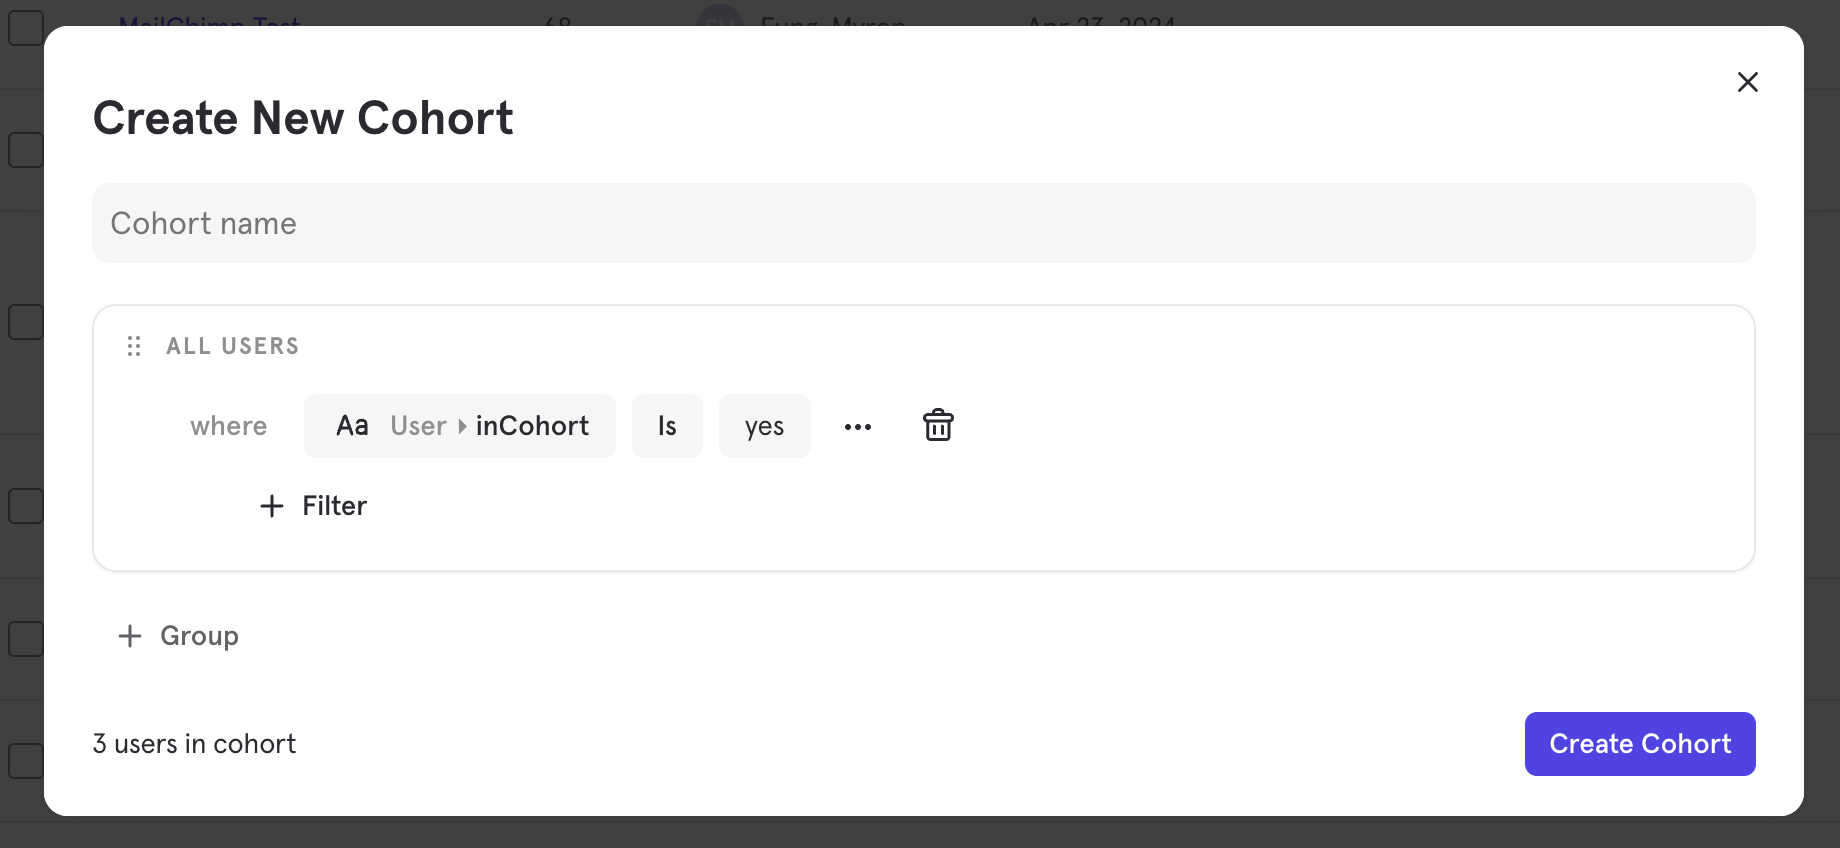
Creating a Cohort via a CSV
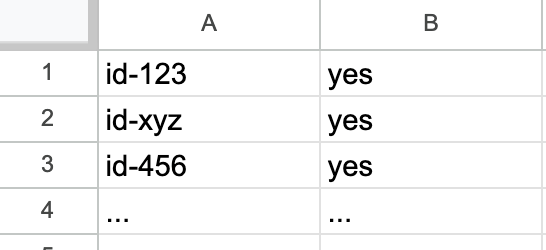
You can create a Cohort by uploading a CSV. This method is useful when grouping Mixpanel users who cannot be easily identified through specific behaviors or user properties. (e.g. when you have a list of distinct_ids to include in a Cohort and they were randomly selected) We will use the CSV to update users in bulk by adding a user property that indicates their Cohort membership. Afterward, we will use this property to define the Cohort. For example, if you have a list of 1,000 distinct_id values to group into a Cohort, create a CSV file with two columns: one containing the distinct_id values and another containing a user property value that identifies cohort membership (e.g.inCohort == "yes"). Exclude column headers from the CSV, as you will define them during the upload process in the CSV upload wizard within the UI.
Using Cohorts in Analysis
You can visualize how cohorts size over time, use cohorts to filter your reports, or compare how cohorts perform a metric.Visualizing Cohort Size Over Time
In Insights, you can define a metric based on the size of a cohort over time. This is useful to understand how key subsets of your user base (like your Power Users) are trending over time. Select a cohort from the “Events and Cohorts” menu in the Insights report; this will generate a line chart that shows the size of the cohort over time. Each point is the size of the cohort as of the end of that time interval.Filtering by a Cohort
You can use cohorts to filter any of your analysis by selecting a cohort from the filter menu. For example, if you’re focused on Onboarding, you can filter all your analyses to the New Users cohort, which might be defined as users who signed up in the past 7 days.Comparing Cohorts
You can compare the behavior of different cohorts by selecting a cohort from the breakdown menu. For example, you can use this to see how engagement compares for Power Users vs All Users. When breaking down metrics by multiple cohorts, events are evaluated independently against each cohort. Consider an insights report that counts all events broken down by 3 cohorts, ‘Power Users in North America’, ‘Power Users in Europe’, and ‘All Power Users’. An event belonging to a power user in North America, would contribute to the sum for buckets,In 'Power Users in North America', In 'All Power Users', and Not In 'Power Users in Europe'.
How Cohorts are Computed
Note: To ensure timely results from queries, newly imported or changed historical events timestamped more than 30 days ago might be part of your existing cohort analysis only after 12 hours from their import/change.
- Run a query to compute the set of users who are in the cohort as of right now (the time that the query is run).
- Run a query to compute the set of users who converted in the funnel, filtering down to the list produced in Step 1.
Cohorts and Time
A common question that customers want to answer is how certain user behavior impact downstream behavior. Should you use cohorts or funnels to answer the question of how many users watch a comedy video and then subscribe? Cohorts and filters will give you different answers. For example, consider this report: https://mixpanel.com/s/4AuMRi For the cohort on Jan 1, I’m looking at the users who watched a comedy video in the last 30 days before Dec 25 and who then subscribed over the same period of time. However, for the funnel on Dec 25, I’m looking at the users who watched a comedy video on Dec 25, and who have then also subscribed anytime within the next 30 day period from Dec 25. This means that if a user subsequently subscribes on Jan 3, the funnel chart can change to take that conversion into account. In this case, if you care about the conversion window, i.e. the amount of time that a user has in order to count as a conversion, using funnels would give you a more accurate answer.Manage Your Cohorts
You can view and manage all cohorts created by you or your teammates within your project by navigating to Lexicon and selecting Cohorts from the left-hand sidebar.Saving and Sharing Cohorts
Growth and Enterprise plan users can save an unlimited number of cohorts. Free plan users can create cohorts but cannot save them. See our pricing page for more details.
Exporting Cohorts
You can download the list of users in any Cohort as a CSV via the Cohort Builder. You can also push Cohorts to native 3rd-party destinations like Segment or Braze using Cohort Sync, or to any other destinations using Custom Webhooks.Verifying Cohorts
Customers on an Enterprise plan can access the Verified Data feature. See our pricing page for more details.
- Navigate to Lexicon > Cohorts.
- Select up to 100 cohorts using the checkboxes, then click Verify. You can also verify a single cohort from the ”…” overflow menu, or by clicking the verified icon in the edit modal.
- Verified cohorts display a badge in the Cohorts table (showing who verified it and when) and appear under a Verified section in query builders. You can also filter the Cohorts table by verification status.
Deleting Unused Cohorts
You can delete any Cohorts from your project by navigating to Lexicon > Cohorts, clicking the “…” button next to the Cohort you wish to delete, and click “Delete”.FAQ
How can I create cohorts based on dropped-off or retained users?
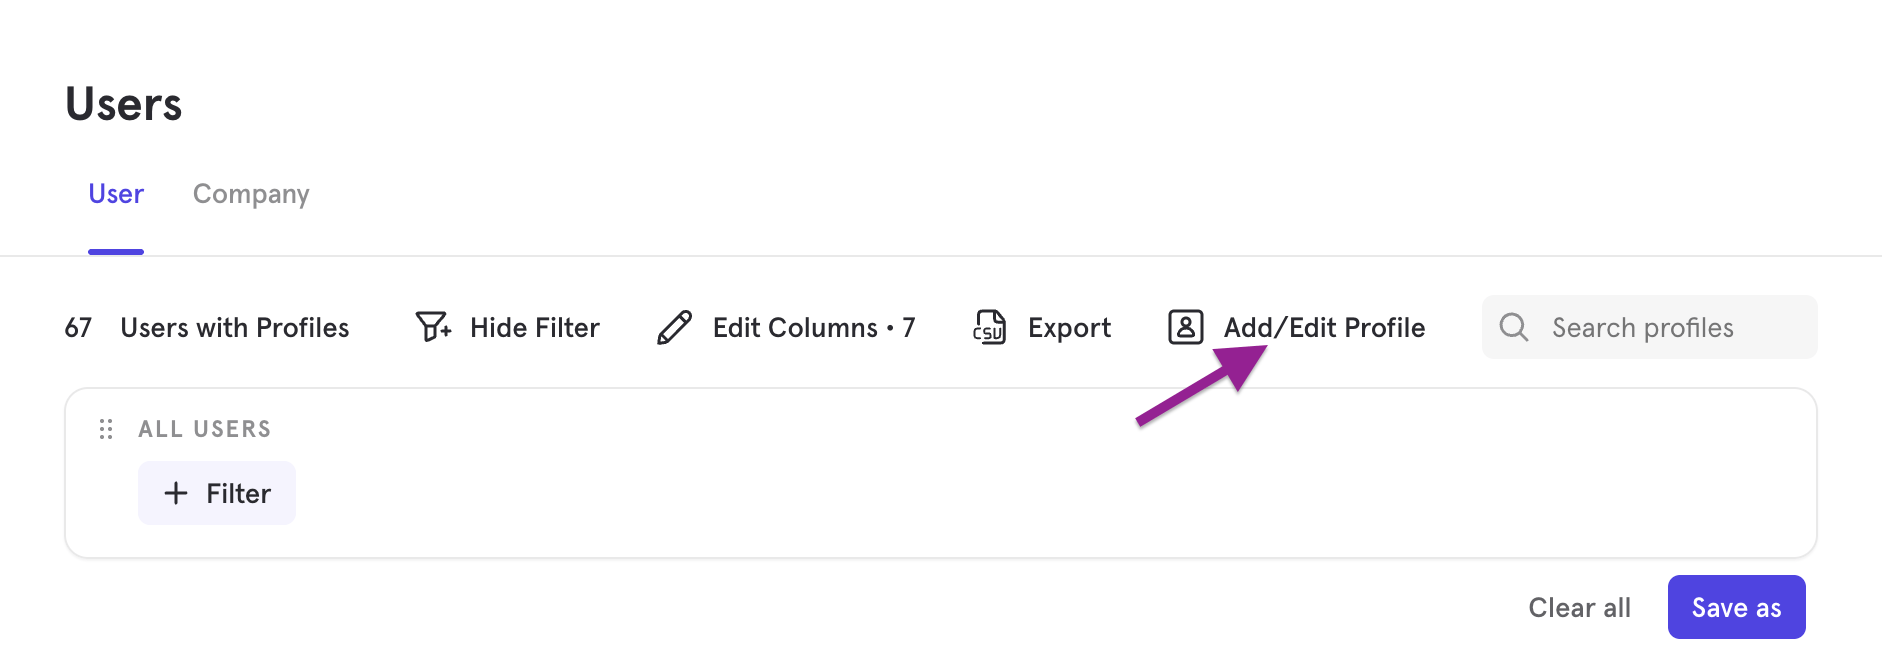
There are two ways to create such cohorts. The first way would be to create a Funnels report and click the respective segments in order to find the retained/dropped-off users. You can then click “View Users”, followed by “Create Cohort”. Here is a Funnels report to play with: https://mixpanel.com/s/8JY6o The second way would be to use the Users page to create cohorts. For example, if you would like to find users who “watch video” and then “like video”. You can create the cohort in the Users page. Here is the cohort for reference: https://mixpanel.com/project/3187764/view/3699044/app/users#T9bjQw9kLb7c If you would like to find those who have dropped off, you could switch “did” to “did not do”. Here is the cohort for reference: https://mixpanel.com/project/3187764/view/3699044/app/users#Umm8E4JZxLSeI created two cohorts, Cohort AA: for users watched videos the last 30 days, and Cohort B: for users who liked videos in the last 30 days. I want to find out the users who did not watch videos AND did not like videos in the last 30 days. How do I create such a cohort?
You can do so by using the “AND” operator. Here is a cohort for reference: https://mixpanel.com/project/3187764/view/3699044/app/users#Tc76sqFRzbao If you were to select multiple cohorts in the filter (example), we will filter by cohort A OR cohort B. Therefore, it is still possible for the following cases to occur:- User is not in Cohort A (fulfils the criteria), but is in Cohort B
- User is not in Cohort B (fulfils the criteria), but is in Cohort A