Mixpanel’s core reports are available on all free and paid subscription plans.
Metrics
Metrics are the values that the report will display. Every metric consists of a measurement of a behavior. An example of a metric is “Unique Users” doing “Sign up”, which is the measurement of unique users, on the behavior of “Sign up”.Behaviors
A behavior is an event or a sequence of events performed within some criteria. A behavior can be something simple, such as a single event, or it can be more complex, like completing a multi-step funnel.Measurements
The measurement tells the metric how to evaluate the behaviors. Some examples of measurements are: total events, unique users, total sessions, conversion rate, retention rate, and aggregate property. Depending on the behavior, certain measurements may not be possible. For example, you cannot use the conversion rate measurement when the metric only has a single event. The measurement is selected in the bottom-left area of the metric.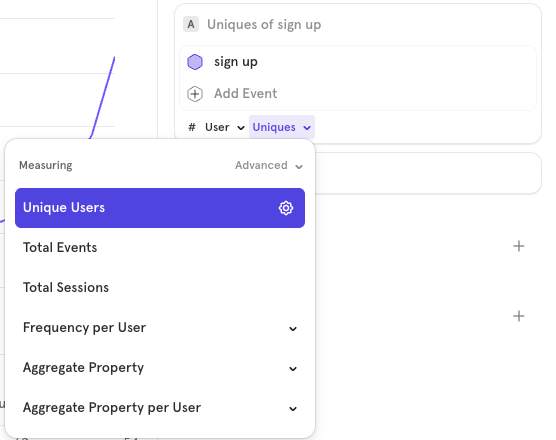
Visualizations
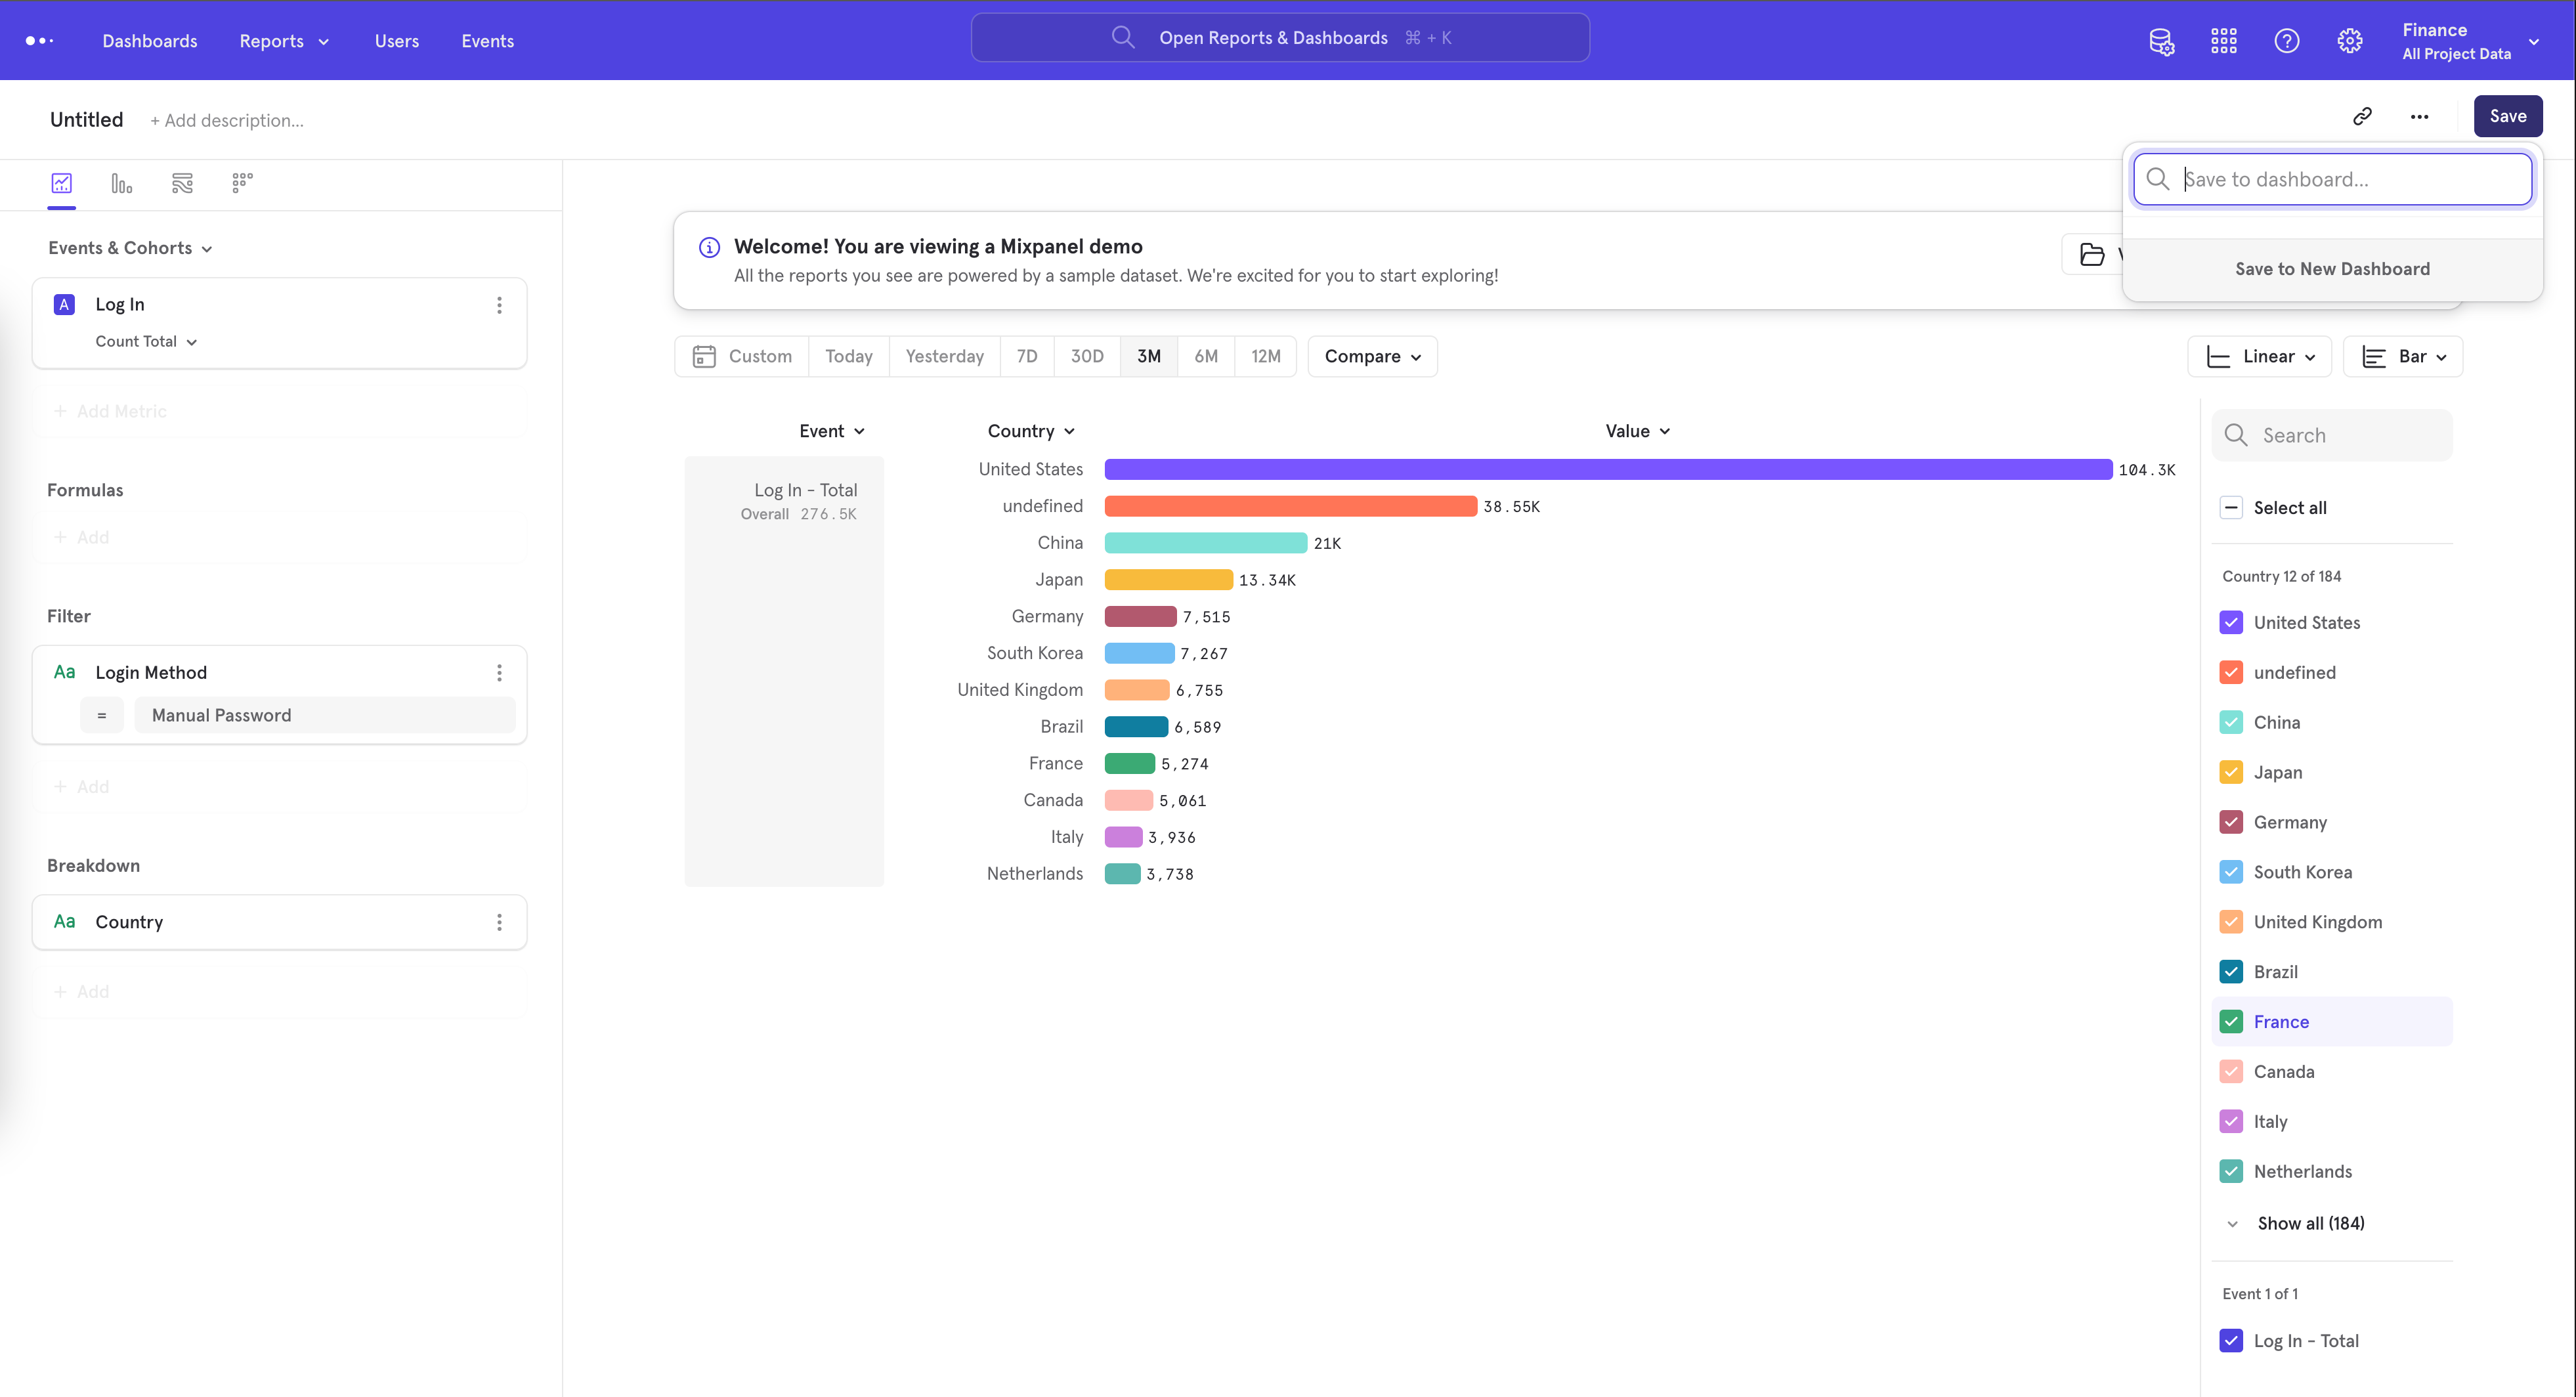
You can change the type of visualization by clicking the dropdown in the upper right corner of the report. The options available will depend on the type of report that you started with. In this case, we switched to a bar view, allowing us to see the total number of “login” events across the entire time range, broken down by the “Platform” property.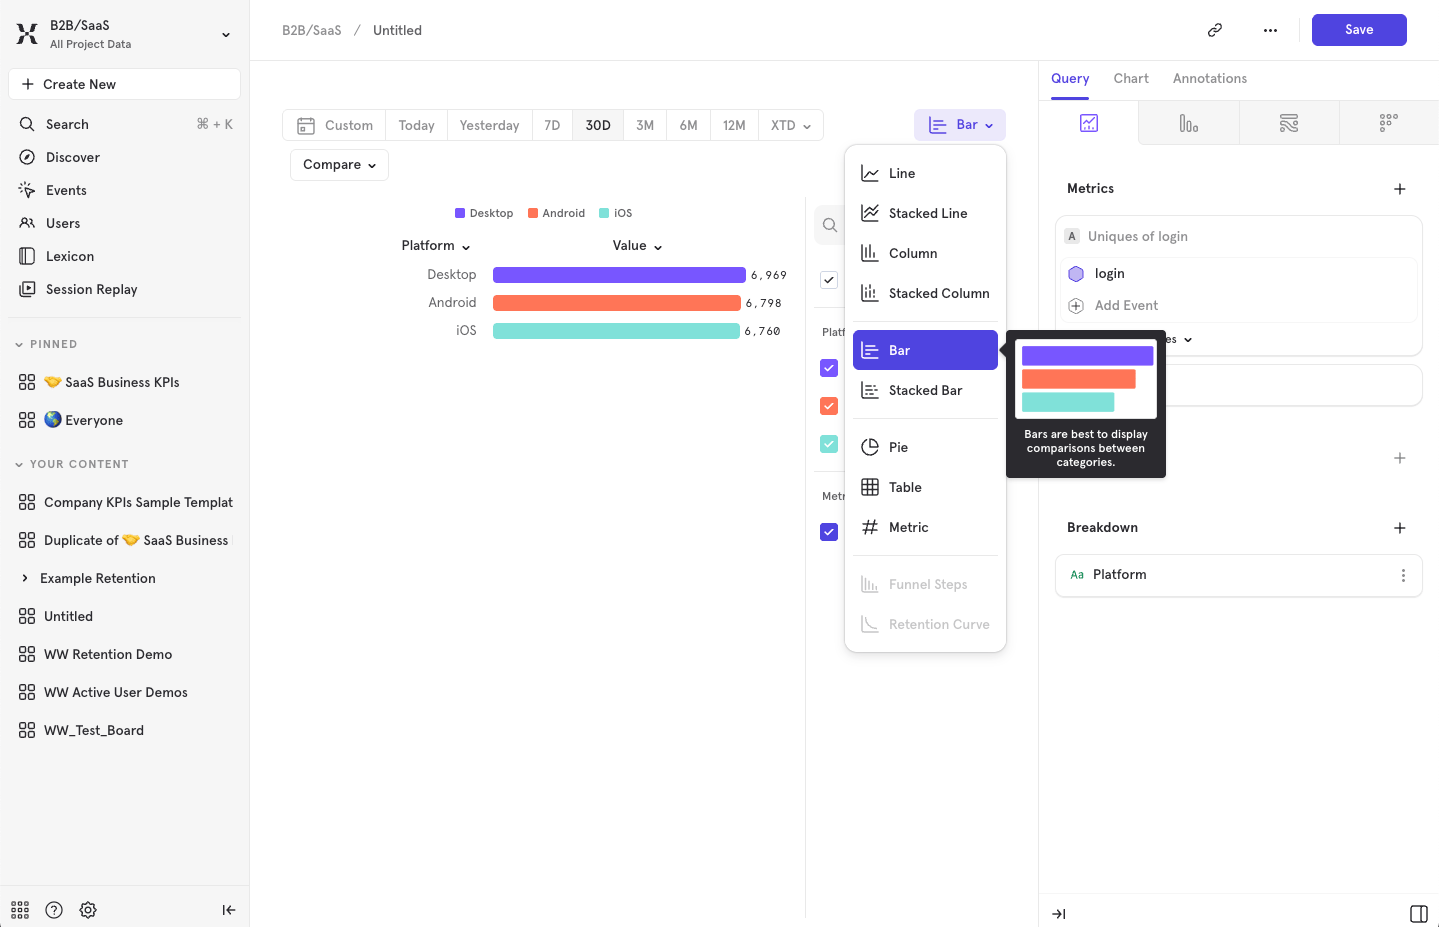
Filters
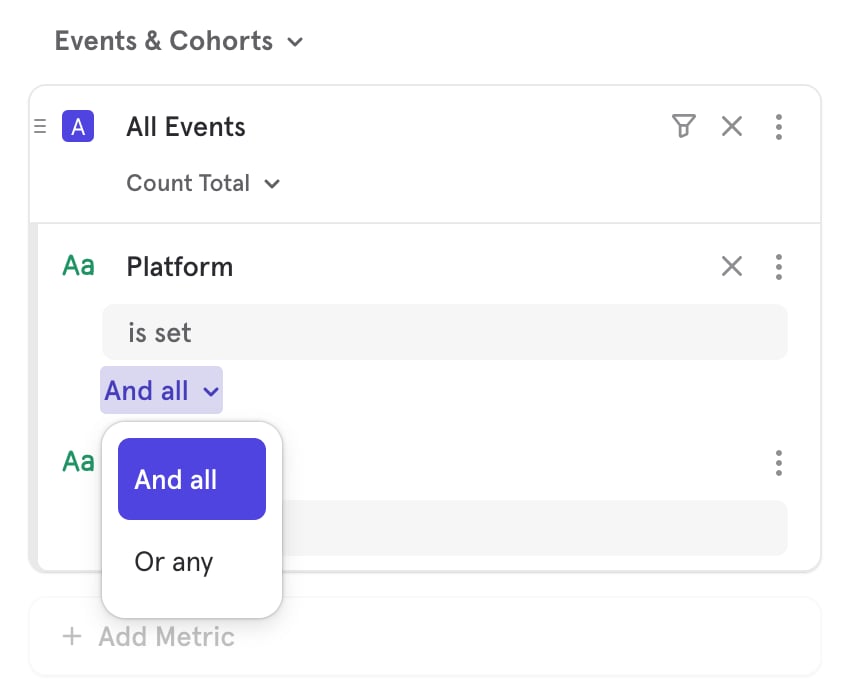
Filters are used to narrow events or behaviors that qualify for analysis. For example, you may want to only consider “Sign Up” events that came from Android. In this case, you would be filtering the “Sign Up” event to only include the “Sign Up” events where the property “Device” is equal to “Android”.Global Filters
A global filter applies to the entire report. Filter by properties or cohorts by clicking the Filter button. This will filter the results of the entire report to show only data with that property or cohort.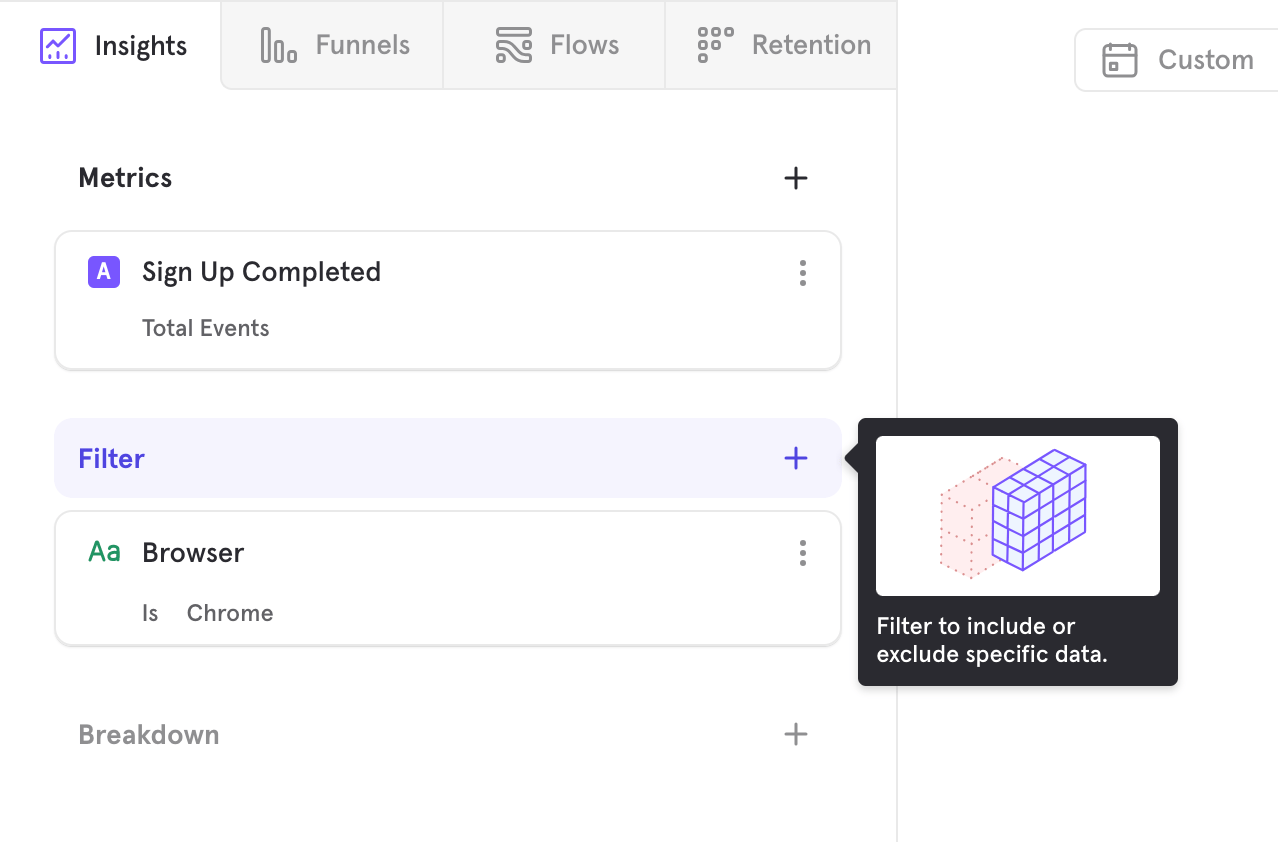
Inline Filters
An inline filter applies to one particular event in the report. Add a filter to your query by clicking on the … icon beside an event, profile, cohort, or step.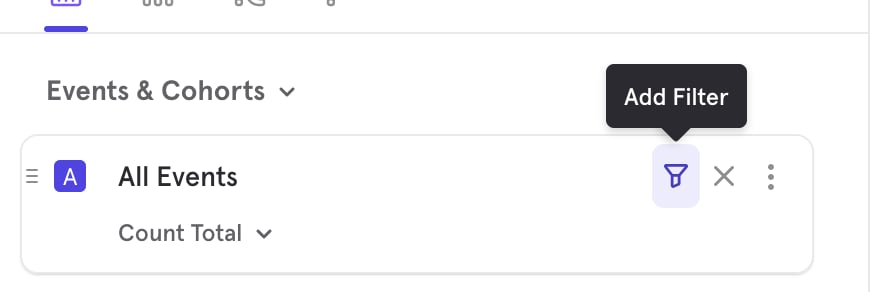
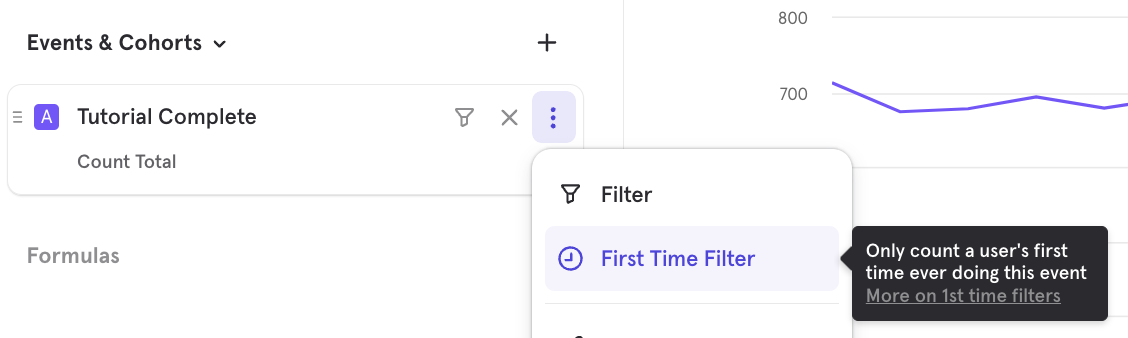
First Time Ever Filter
Sometimes, you might want to filter an event to only the first time that it’s performed by a user. This helps answer the following questions:- How many users sign up or perform another key event for the first time each week?
- Which referrers do most first-time users come from?
- How quickly do users make a purchase after their first time engaging with the app?
- How well do users retain after performing a key event for the first time?
- What events do users perform before and after making their first purchase?
Breakdowns
Breakdown groups the results of your metrics in Insights, Funnels, Flows, or Retention reports by a property or cohort, allowing you to examine which properties or cohorts have a significant impact on your query. This feature is useful for determining if a group factor, such as browser type, is having an impact on the way users interact with your product. Breakdown will display counts, such as the number of events performed or the conversion rates with that property value. Select the Breakdown button, and select the property or cohort you want to break down your results by.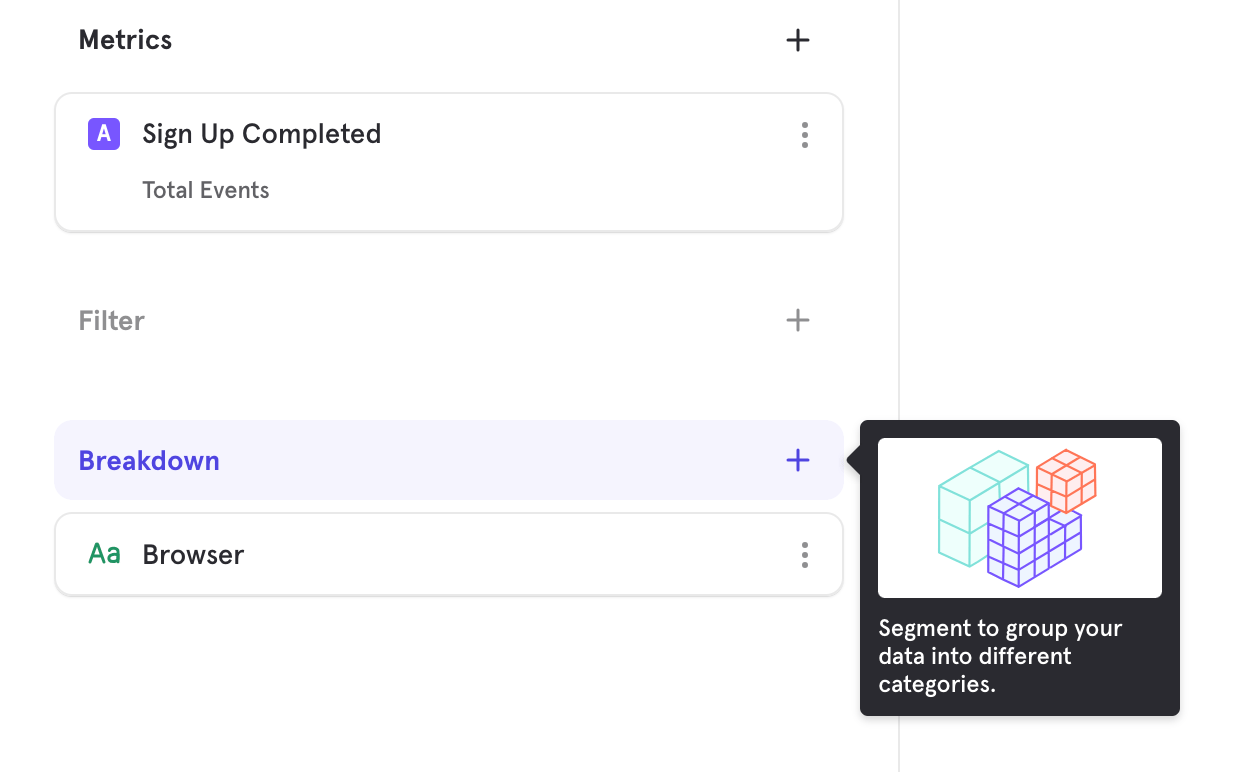
Events Menu
This is the menu that appears under “Add Metric” or “Select Step”. By default, the event menu shows all events, except for hidden events. If you organize your events using tags in Lexicon, the tags will show up as filtering options in the event menu. When you select a tag, a list of events that share the same tag appears: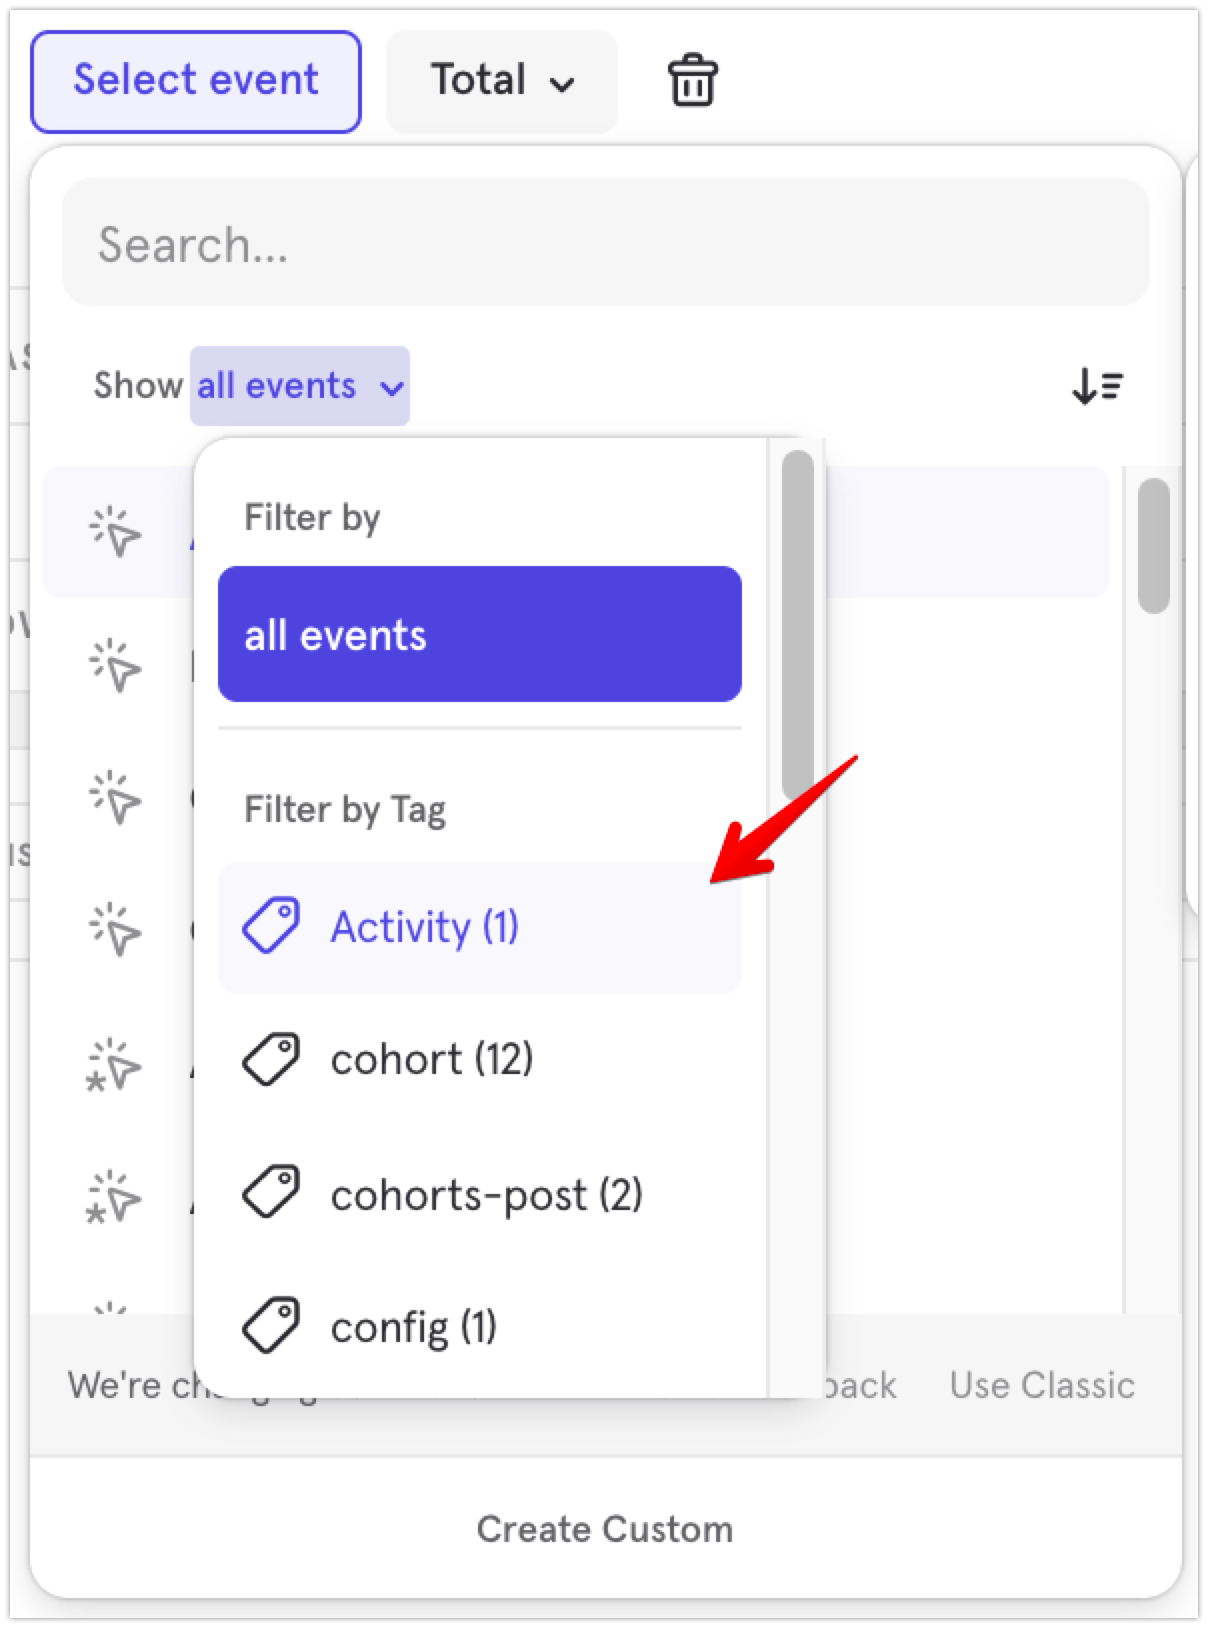
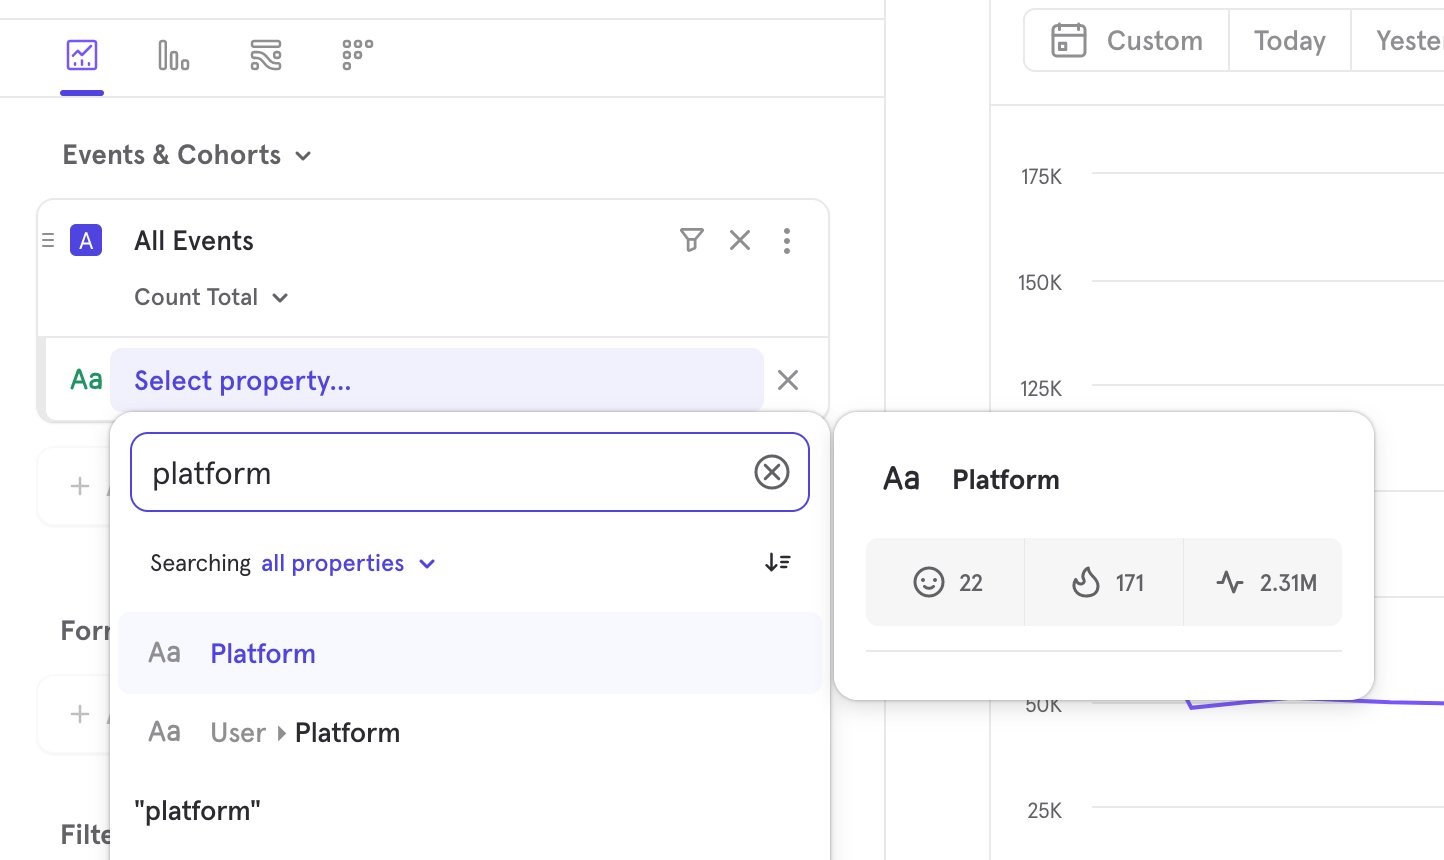
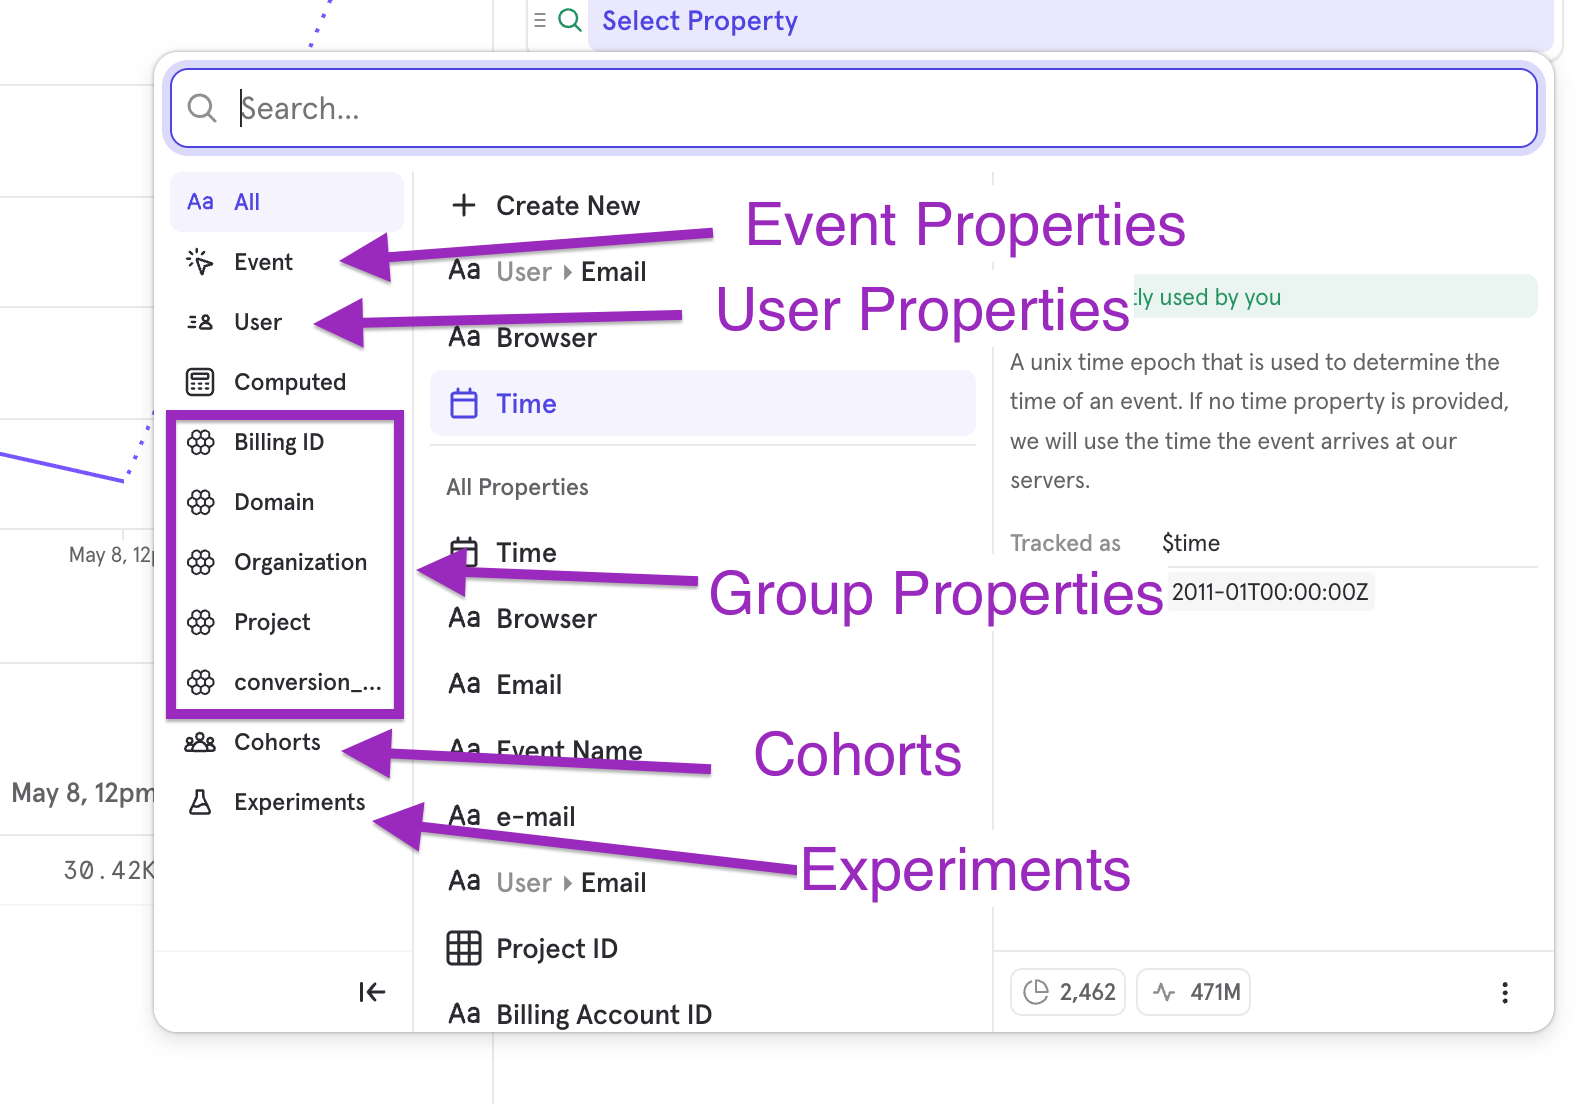
Properties Menu
This menu appears when adding a filter, an inline filter on an event, or a breakdown. By default, the menu shows all properties; this includes event properties, profile properties, group properties, lookup properties, and cohorts. You can select the following filtering options to show a subset of the properties in the menu:- Select “Event” to show only the Event properties.
- Select “User” to show only the Profile properties.
- If you set up Group Analytics, the group keys will show up individually under their display names. You can select any Group key to show only the Group properties relevant to the selected Group key.
- Select “Cohorts” to show only the Cohorts.
- If you set up Experiments, the experiments will show up individually under their display names.
Duplicating Metrics
To duplicate any metrics or properties in your query, select the inline action menu and choose Duplicate. Delete any events or properties by clicking the trash icon.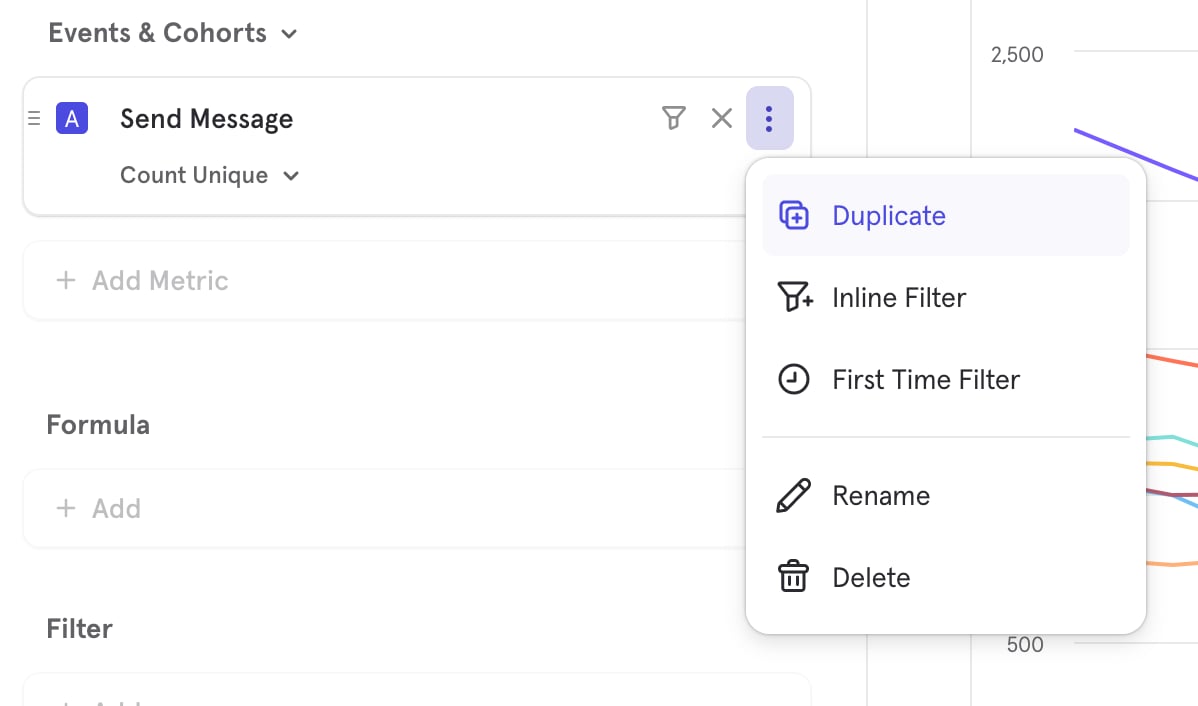
Date Range
Determine the time range of a query by clicking on the date range selector. The date range selector is common across all reports. All dates and times in Mixpanel reflect the project timezone. The default on most reports is “Last 30 days” (displayed as “30D”), but there are a variety of preset options, as well as the option to select a custom date range.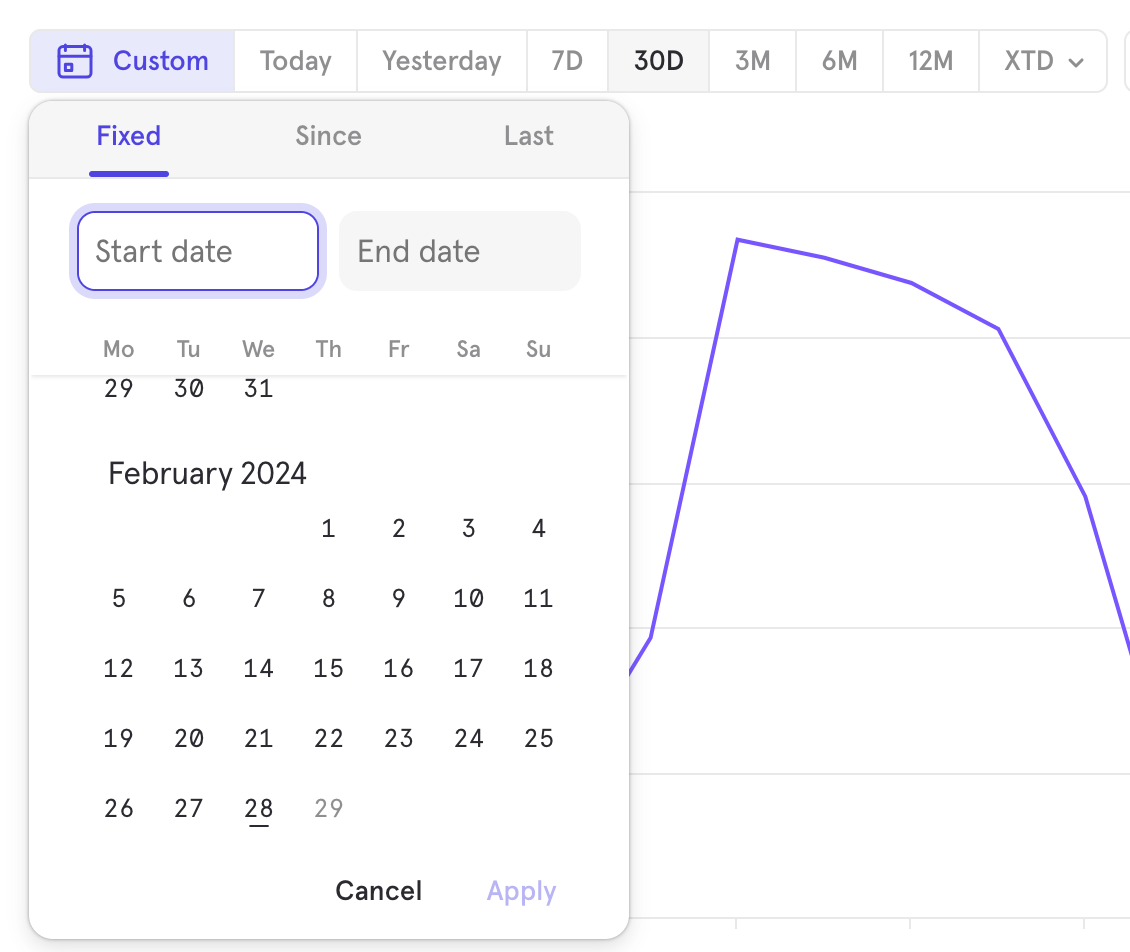
| Preset | Description |
|---|---|
| Today | Includes the current incomplete day up to the current second. |
| Yesterday | Includes the whole of the previous day from midnight to midnight. |
| Last 7 days | Last 7 days and the query count from the current incomplete day up to the current second. |
| Last 30 days | Last 30 days and the query count from the current incomplete day up to the current second. |
| Last 3 months | Last 3 months and the query count from the current incomplete day up to the current second. |
| Last 6 months | Last 6 months and the query count from the current incomplete day up to the current second. |
| Last 12 months | Last 12 months and the query count from the current incomplete day up to the current second. |
| Week to Date | From midnight of the start of the current week up to the current second. |
| Month to Date | From midnight of the start of the current month up to the current second. |
| Quarter to Date | From midnight of the start of the current quarter up to the current second. |
| Year to Date | From midnight of the start of the current year up to the current second. |
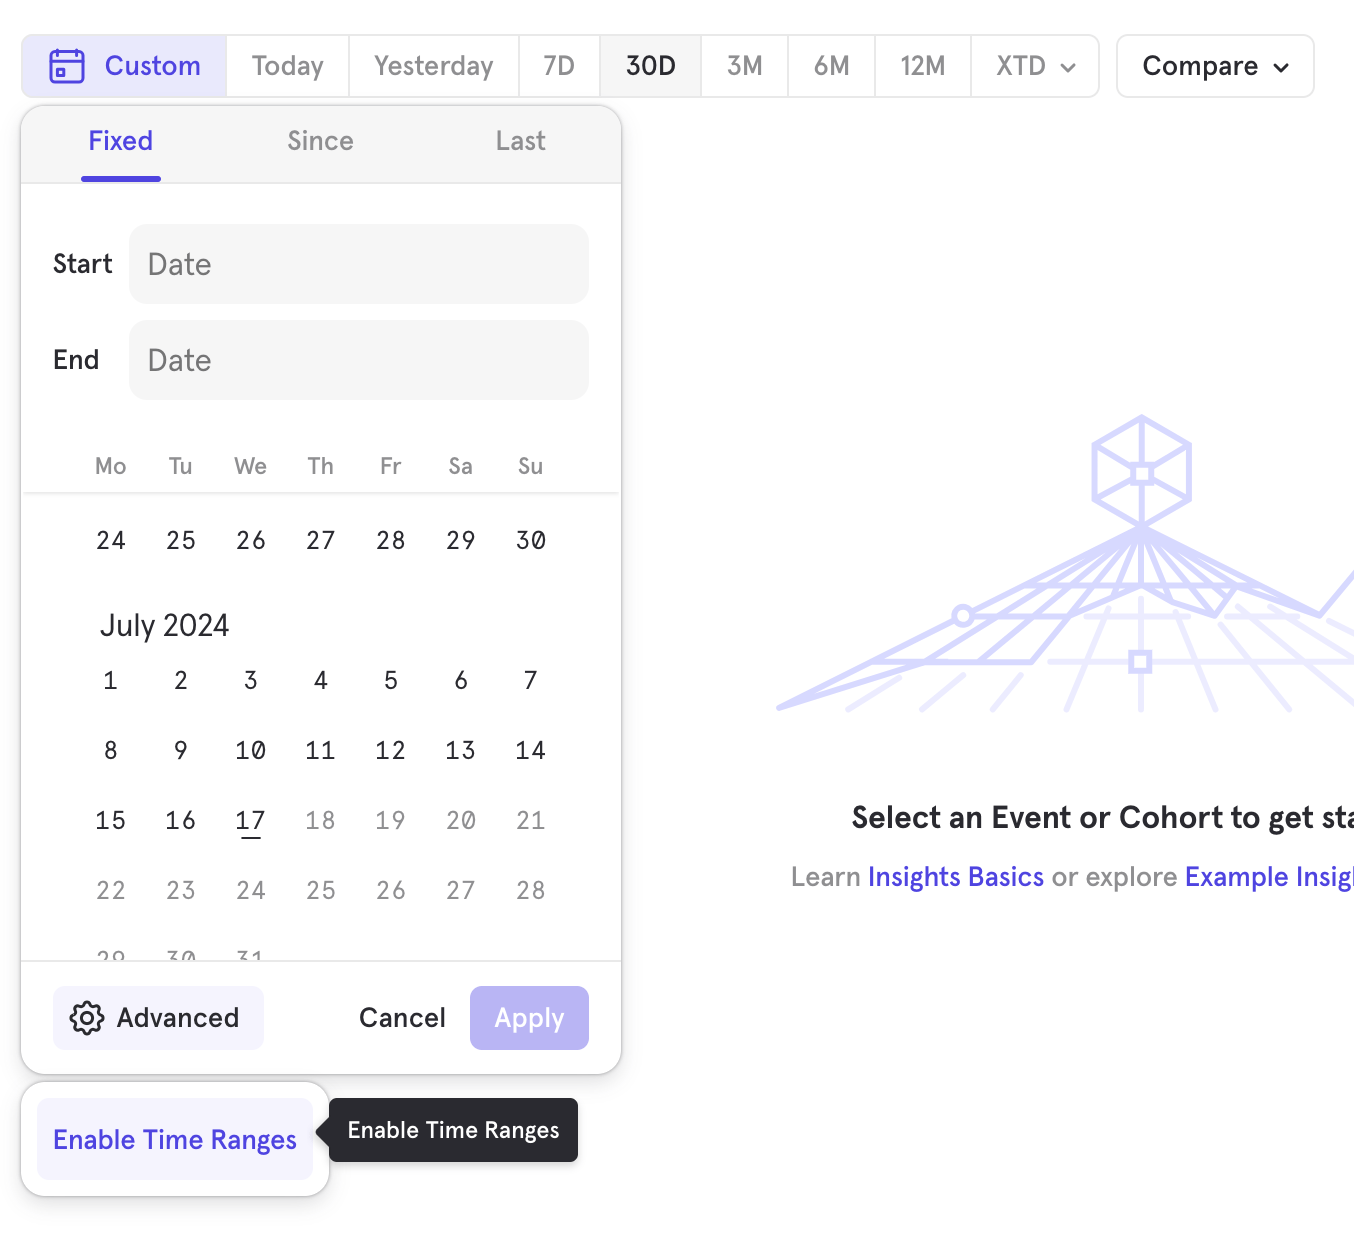
Select a Date Range
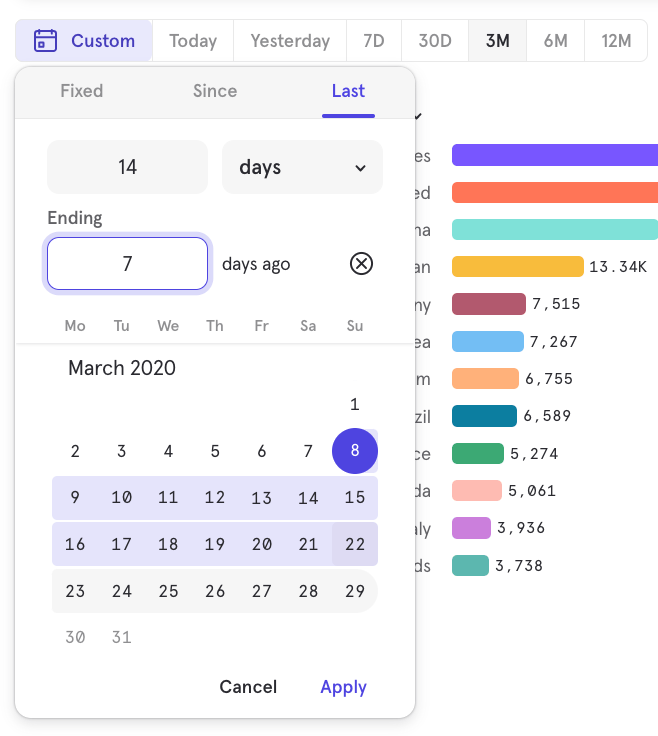
Selecting Custom on the date range selector opens up some additional options: “Last”, “Fixed”, and “Since”.Last
“In the last” allows you to select a rolling time range similar to the default “last 30 days”, but you have the flexibility to choose the time value and scale, either days, weeks, or months.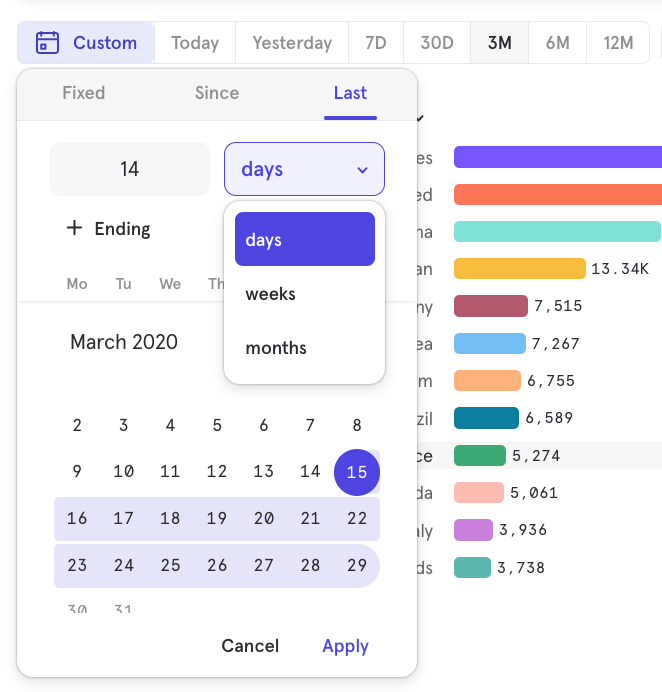
Fixed
“Fixed” allows you to select two dates to query between, by entering the same start & end date. If you save this report as a bookmark or add it to a board, the date range selection will always persist.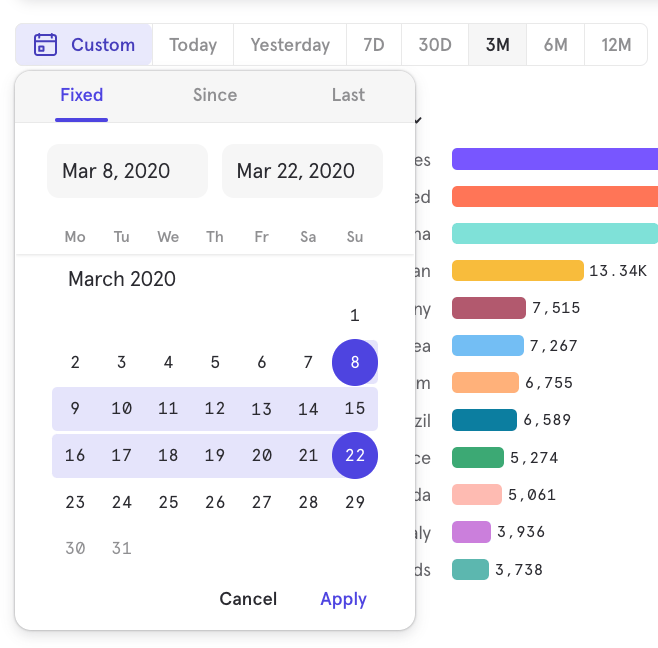
Since
“Since” allows you to select a specific date to query for all data since that start date.To Date
“To Date” allows you to select a date range that will update dynamically to fit the current interval. You can choose ‘Week to Date’, ‘Month to Date’, ‘Quarter to Date’, and ‘Year to Date’. When the boundary of the interval is passed, the date range will automatically update to include only the current interval. For example, if “Month to Date” was selected, and the date was February 27, the date range would include Feb 1 - Feb 27. The next week, after the month boundary has passed, the date range would include Mar 1 - Mar 4. To Date respects start of week and start of quarter settings under project settings.Minute Level Granularity
Zoom In
To zoom in, click on the graph and drag to highlight a specific window of time in your report. Click Reset zoom to return to the previous view.
Comparisons
Comparisons allow you to compare metrics or broken-down segments of metrics against each other. Depending on the type of comparison, you are also able to see the lift of a segment or metric against another.Compare to Past
‘Compare to Past’ allows for comparing a metric against itself on a different time period. You are able to compare against the previous day, week, month, quarter, and year. You are also able to choose a custom time comparison window.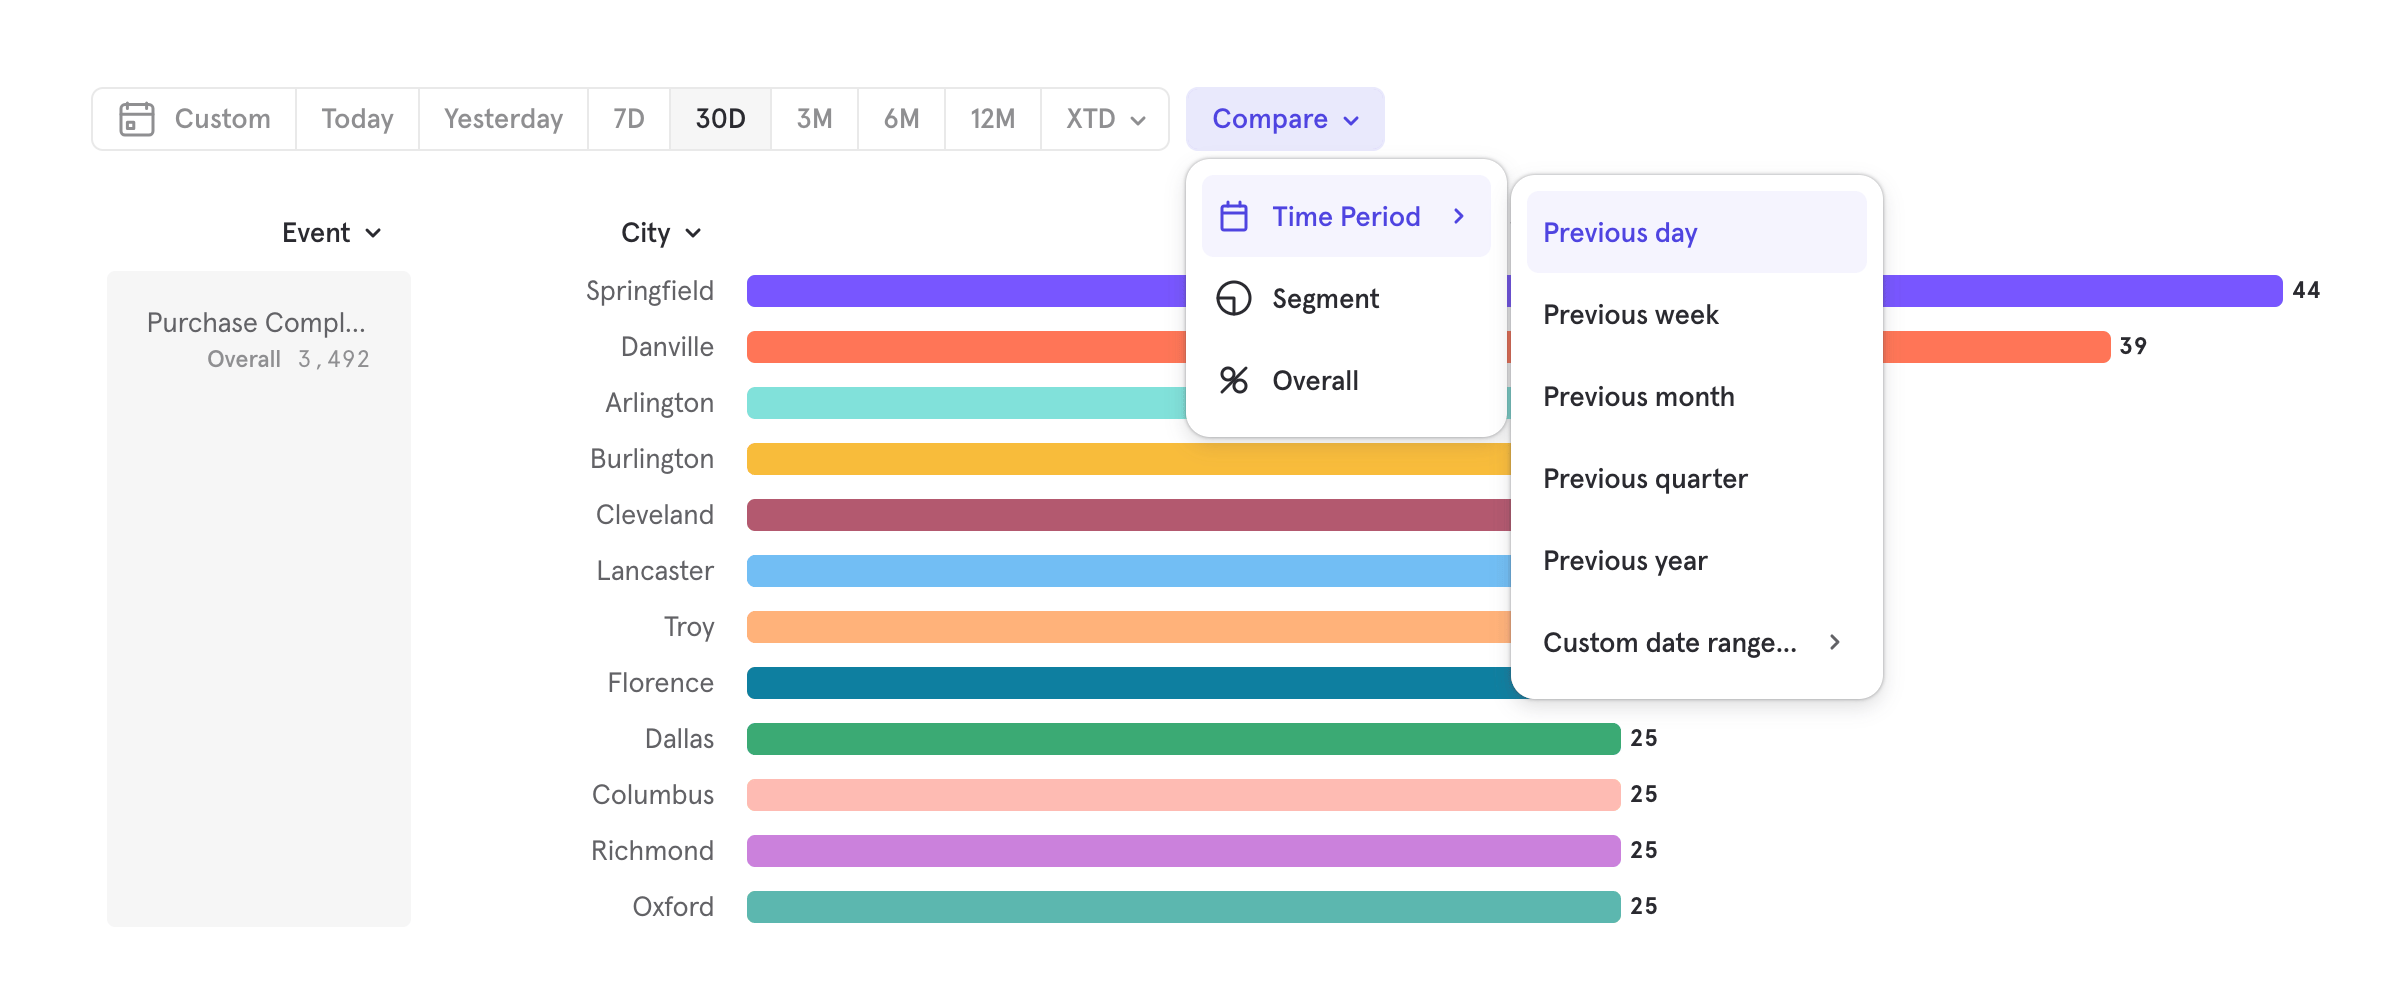
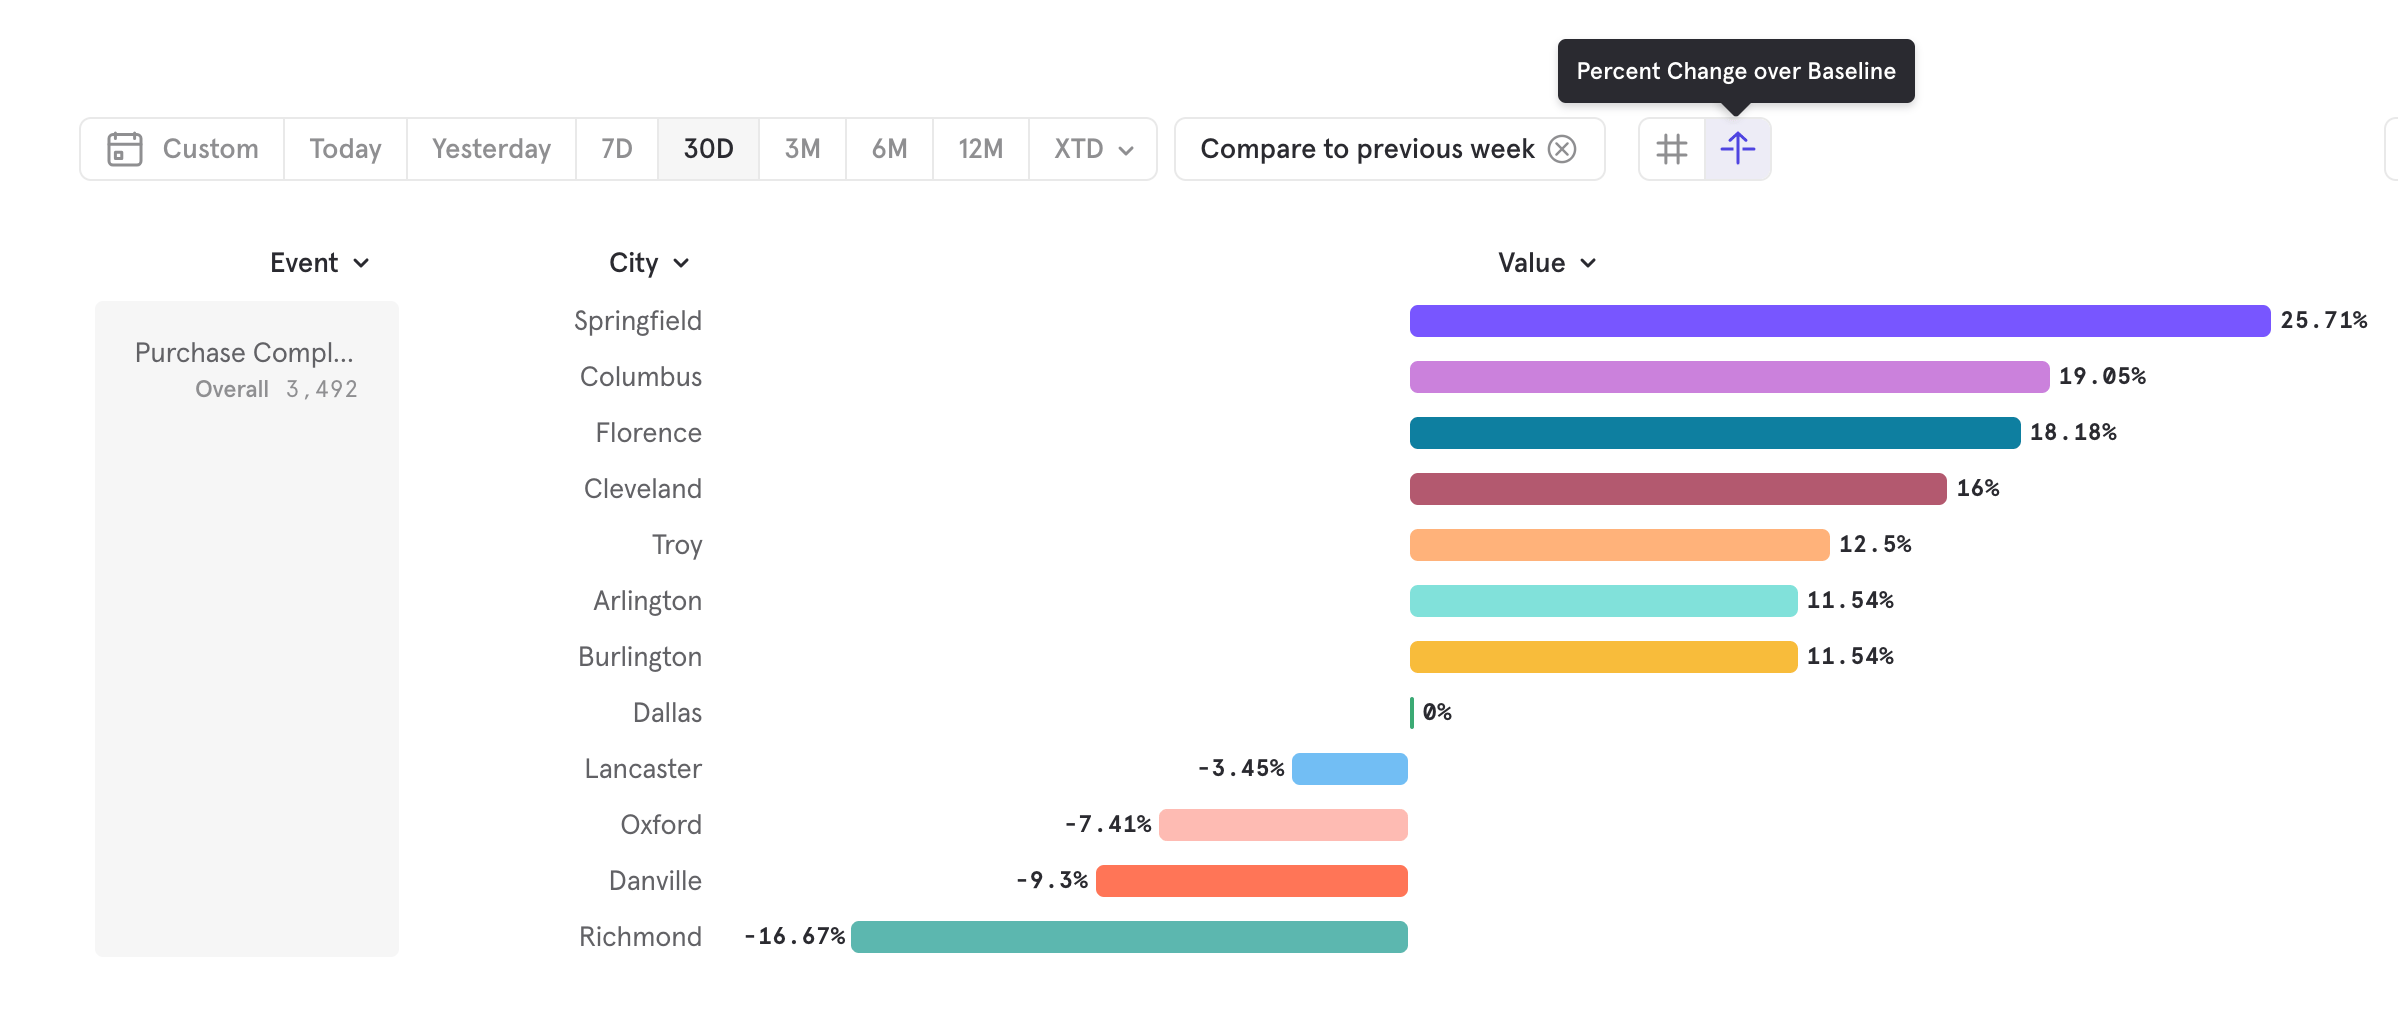
Compare to Segment
Compare to segment allows you to set a property value as a baseline and see how every other property compares.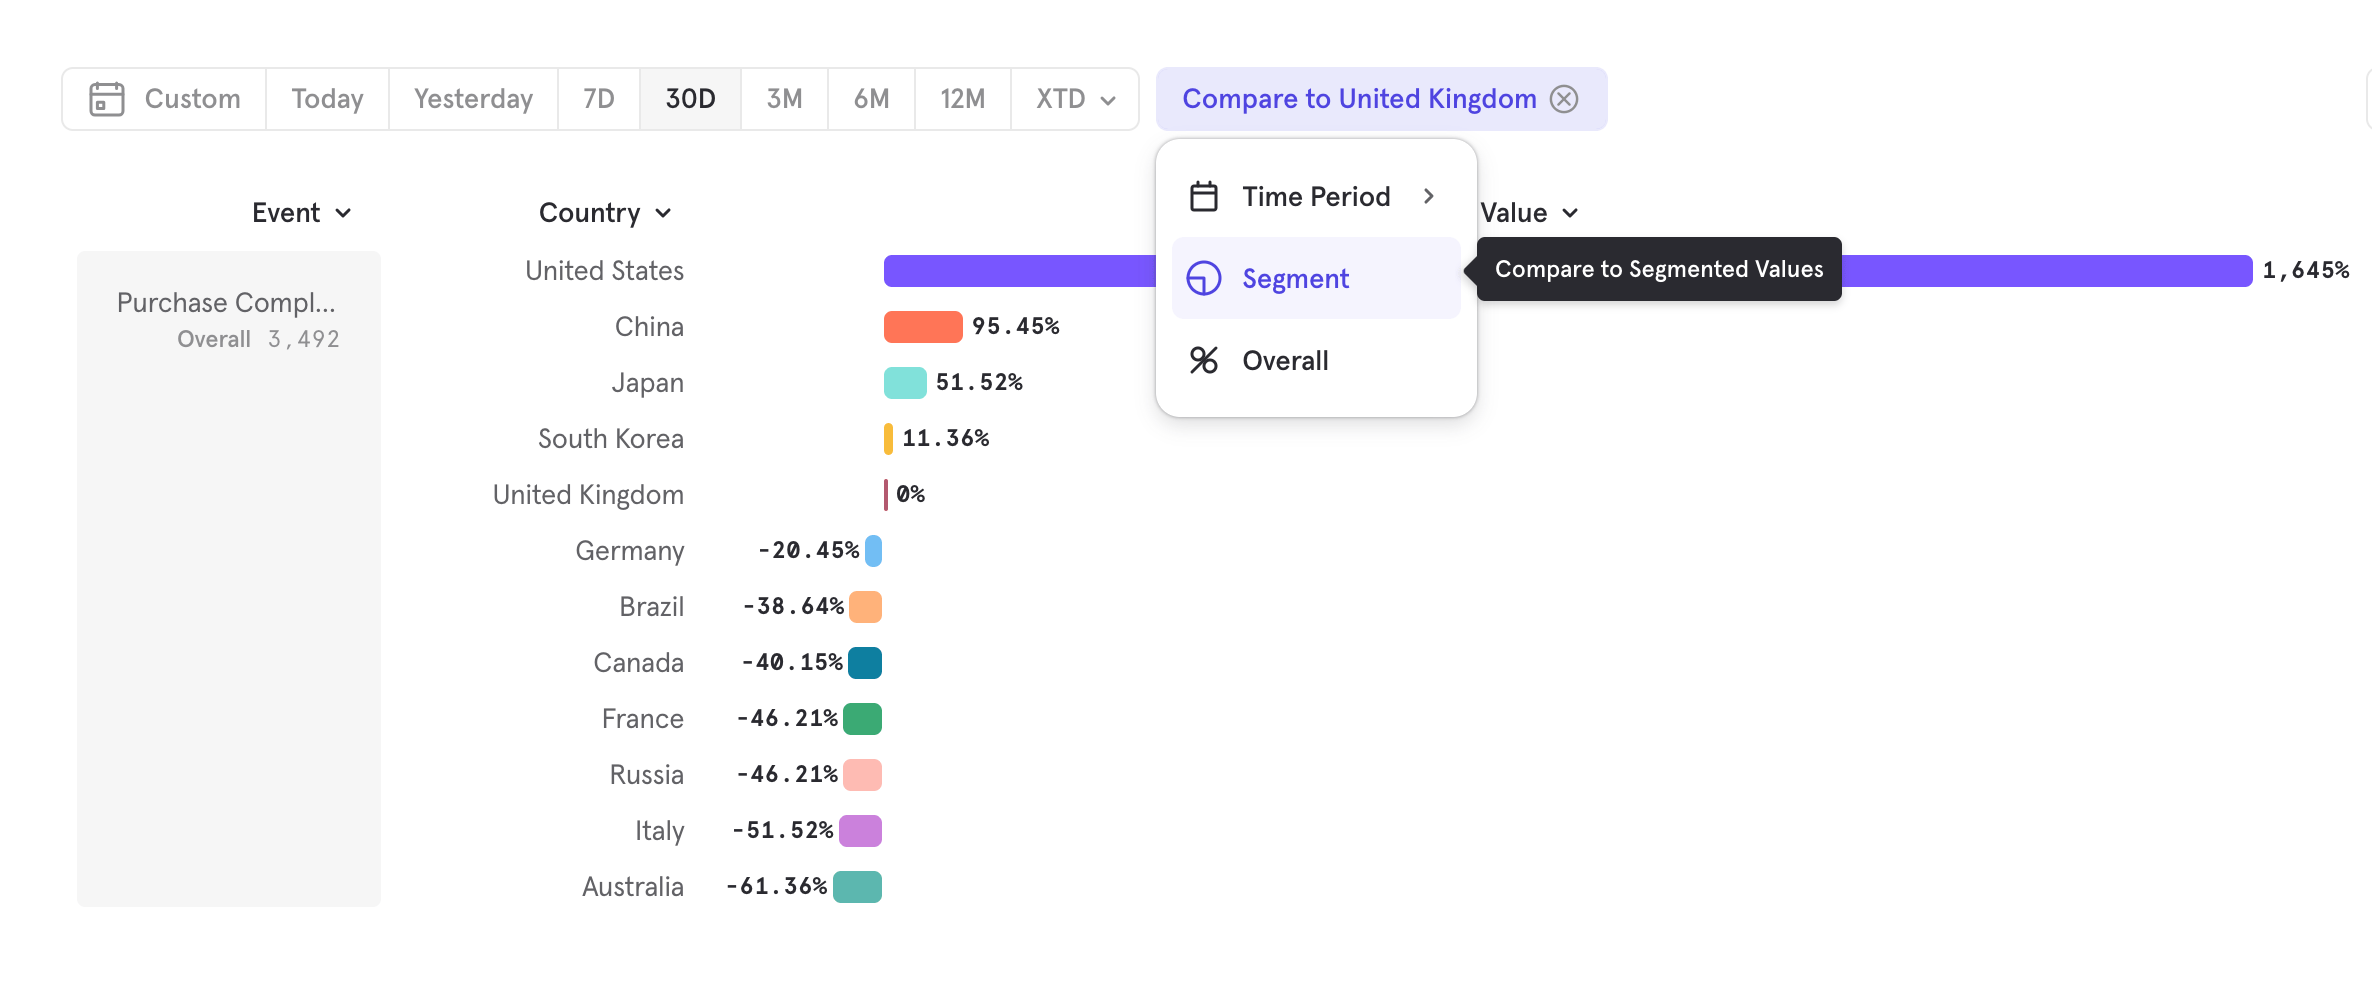
Compare to Overall
‘Compare to Overall’ allows you to compare each segment value and see what proportion it makes of the overall value.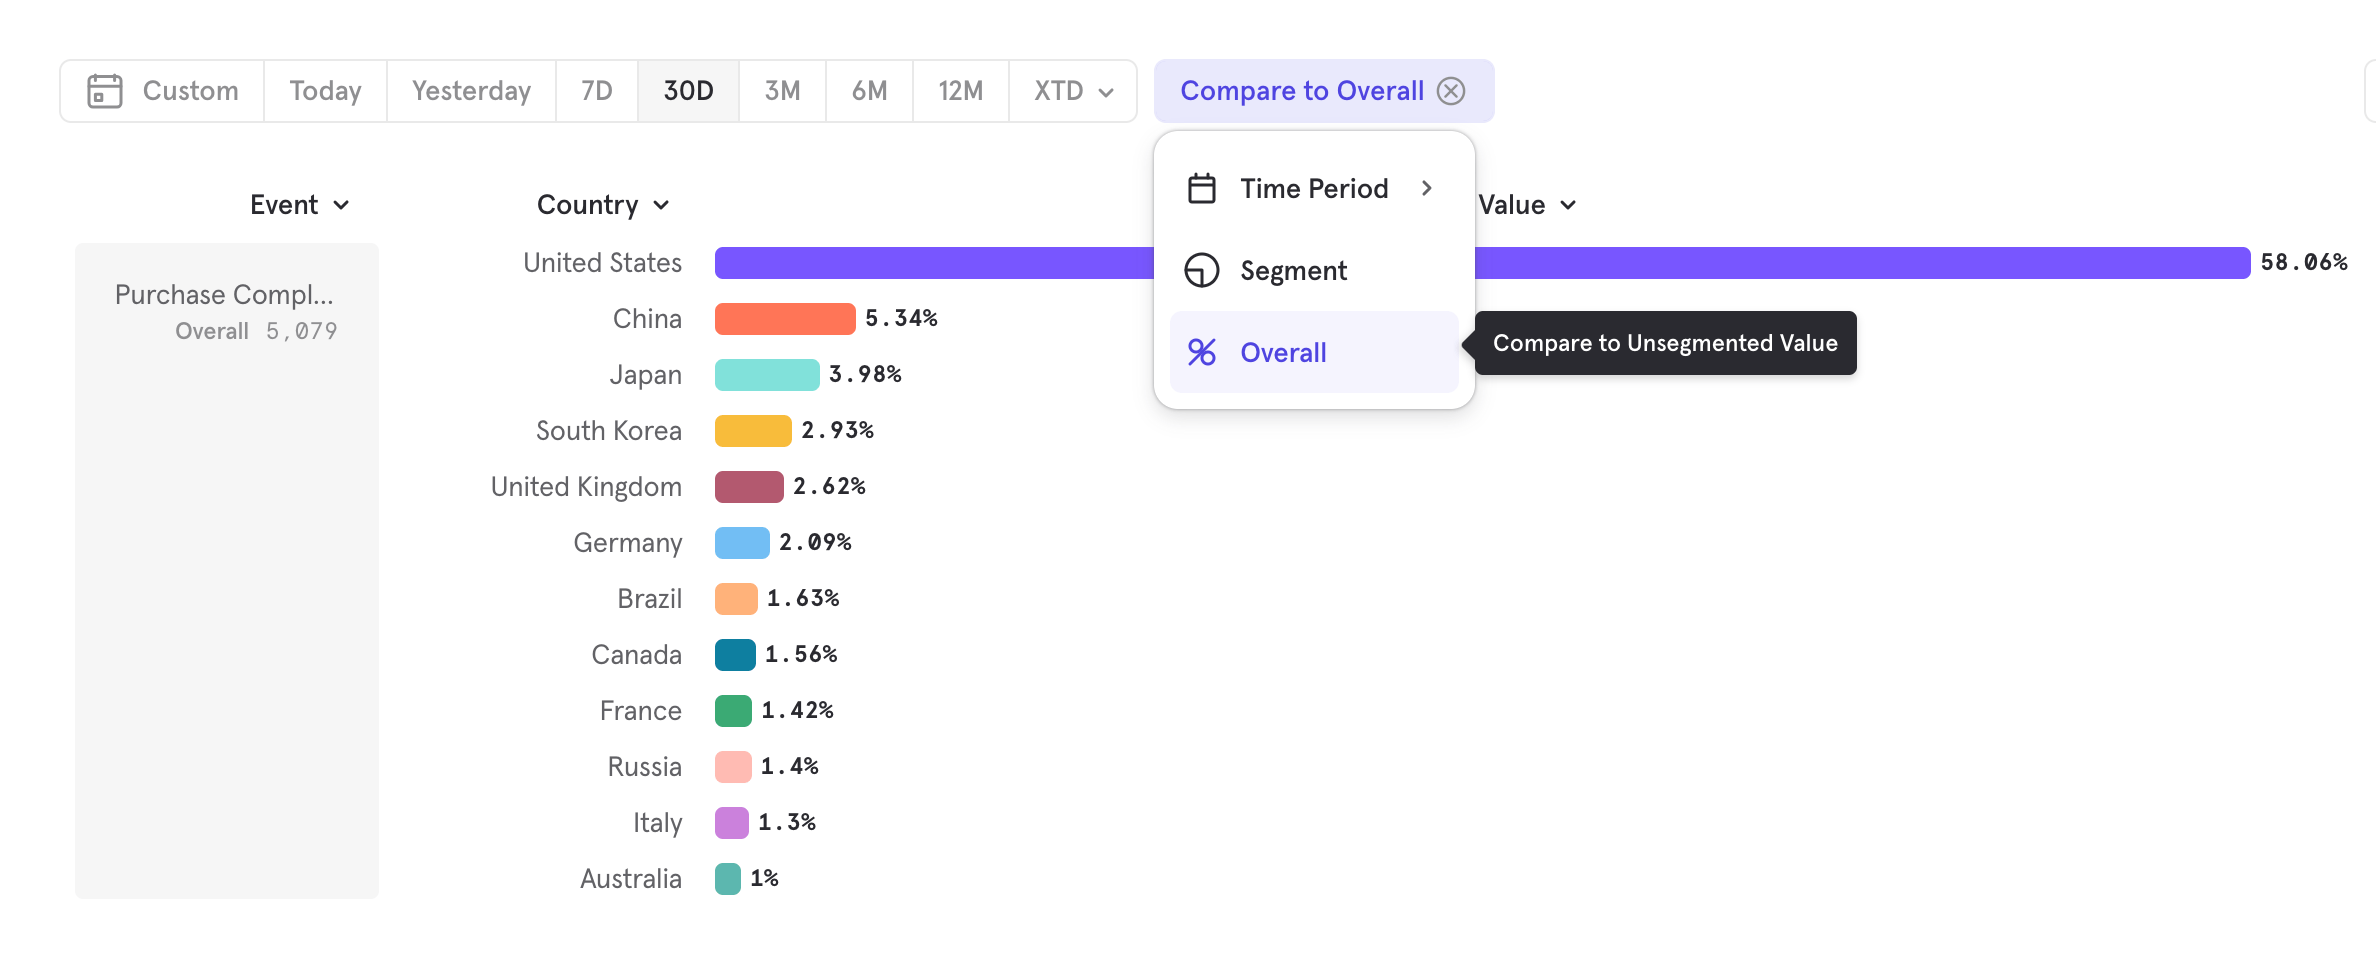
Supported Charts
Comparisons are supported across all insights chart types. Depending on the exact configuration chosen, certain comparison operations may be disabled.| Chart Type | Time Comparison Supported | Percentage change over Baseline Supported | Percentage of Overall Supported |
|---|---|---|---|
| Insights Line | Yes | Yes | Yes |
| Insights Stacked Line | No | No | Yes |
| Insights Bar | Yes | Yes | Yes |
| Insights Stacked Bar | Yes | No | No |
| Insights Pie | No | No | No |
| Insights Metric | Yes | Yes | Yes |
| Funnels Steps | Yes | Yes | No |
| Funnel Trends | Yes | Yes | No |
| Retention Curve | No | Yes | No |
| Retention Trends | Yes | Yes | No |
Saving to a board
Free plans allow each user to save up to 5 reports. Growth and Enterprise plan users can save an unlimited number of reports. See our pricing page for more details.
Typecasting
Mixpanel allows you to force Properties into another data type by using the “Data Type” option in the overflow menu for property filters and breakdowns.
View Users
View Users is a streamlined process for exploring the users contributing to a specific metric or point on a chart. By interacting with the chart, you can view a group of users experiencing friction or dig deep into which users are driving feature adoption. View Users can help you:- See the users contributing to any metric and view their recent activities & properties.
- Save these users as a cohort.
- Export these users to a CSV file.
Segment Limits and Ordering
In order to keep the interactive analysis experience snappy for projects of all sizes, Mixpanel limits how many segments are returned when using breakdowns. When breakdown (also referred to as segmentation) limits are reached, the response will be truncated to only return the top N segments. We have higher limits available via CSV exports.UI
We are changing how many segments are returned to the report (visible limit), how many segments can be selected at a time for visualization (selection limit), as well as the number of segments selected by default (default selection). Here is the breakdown per report visualization type:| Report Viz | Default Selection | Selection Limit | Visible Limit |
|---|---|---|---|
| Insights (table) | 12 | 3000 | 3000 |
| Insights (bar) | 12 | 300 | 3000 |
| Insights (line & pie) | 12 | 50 | 3000 |
| Insights (metric, column) | 6 | 12 | 3000 |
| Retention | 6 | 12 | 200 |
| Funnels | 6 | 12 | 200 |
CSV Export
When exporting a report as CSV, we offer elevated limits. For most reports, the CSV export limit is 10,000. For insights non-line charts, we allow for up-to 50,000.Top Segments logic
The way we pick the top segments differs according to the type of query. We choose the top segments based on the value shown in the metric value column.| Query type | How we select top segments |
|---|---|
| Total | Total number of occurrences of the chosen event |
| Unique | Number of unique users who performed the chosen event |
| Sum of property values | Sum of the chosen property |
| Min/max of property values | Lowest/highest value of the chosen property |
| Average | Number of events (or users) that contribute to the average |
| Median/Percentile/Distribution | Number of events (or users) that contribute to the distribution |
| Distinct count | Number of distinct values of the chosen property |
| DAU/WAU/MAU | Number of unique users |
| Sessions | Number of sessions that contain the chosen event |
| Funnels | Total number of times the first funnel step was completed |
| Retention | Total number of times the first event was completed |
Multi-metric and formula reports
Since our top N logic is determined per metric, multi-metric and formula reports that have breakdowns that exceed segment cardinality limits may experience a few awkward edge cases where the different metrics’ top N segments are misaligned. We highly recommend using filters to bring your segment count under our cardinality limit to ensure the same segments are selected across metrics - ensuring formula accuracy and a more user-friendly report viewing experience. You may also wish to use CSV exports for these cases.Multi-breakdown reports
For multi-segmentation or multi-breakdowns, we define the top N segments based on the top N flattened segments, which are the combination of the individual segment values across all breakdowns. For example, for a breakdown by Country and Browser, we treat “United States/Chrome” as one flattened segment for our segmentation limits.How will I know if my results are being truncated?
You will see a banner at the top of your report indicating that results were truncated, what limit was applied, and what CSV export limit is available.
Query Time Sampling
This feature is available to customers with an Enterprise subscription plan in projects with over 2 billion monthly events.
Enable Sampling
From the report in which you would like to use sampling, click the lightning bolt in the upper right corner of the query builder.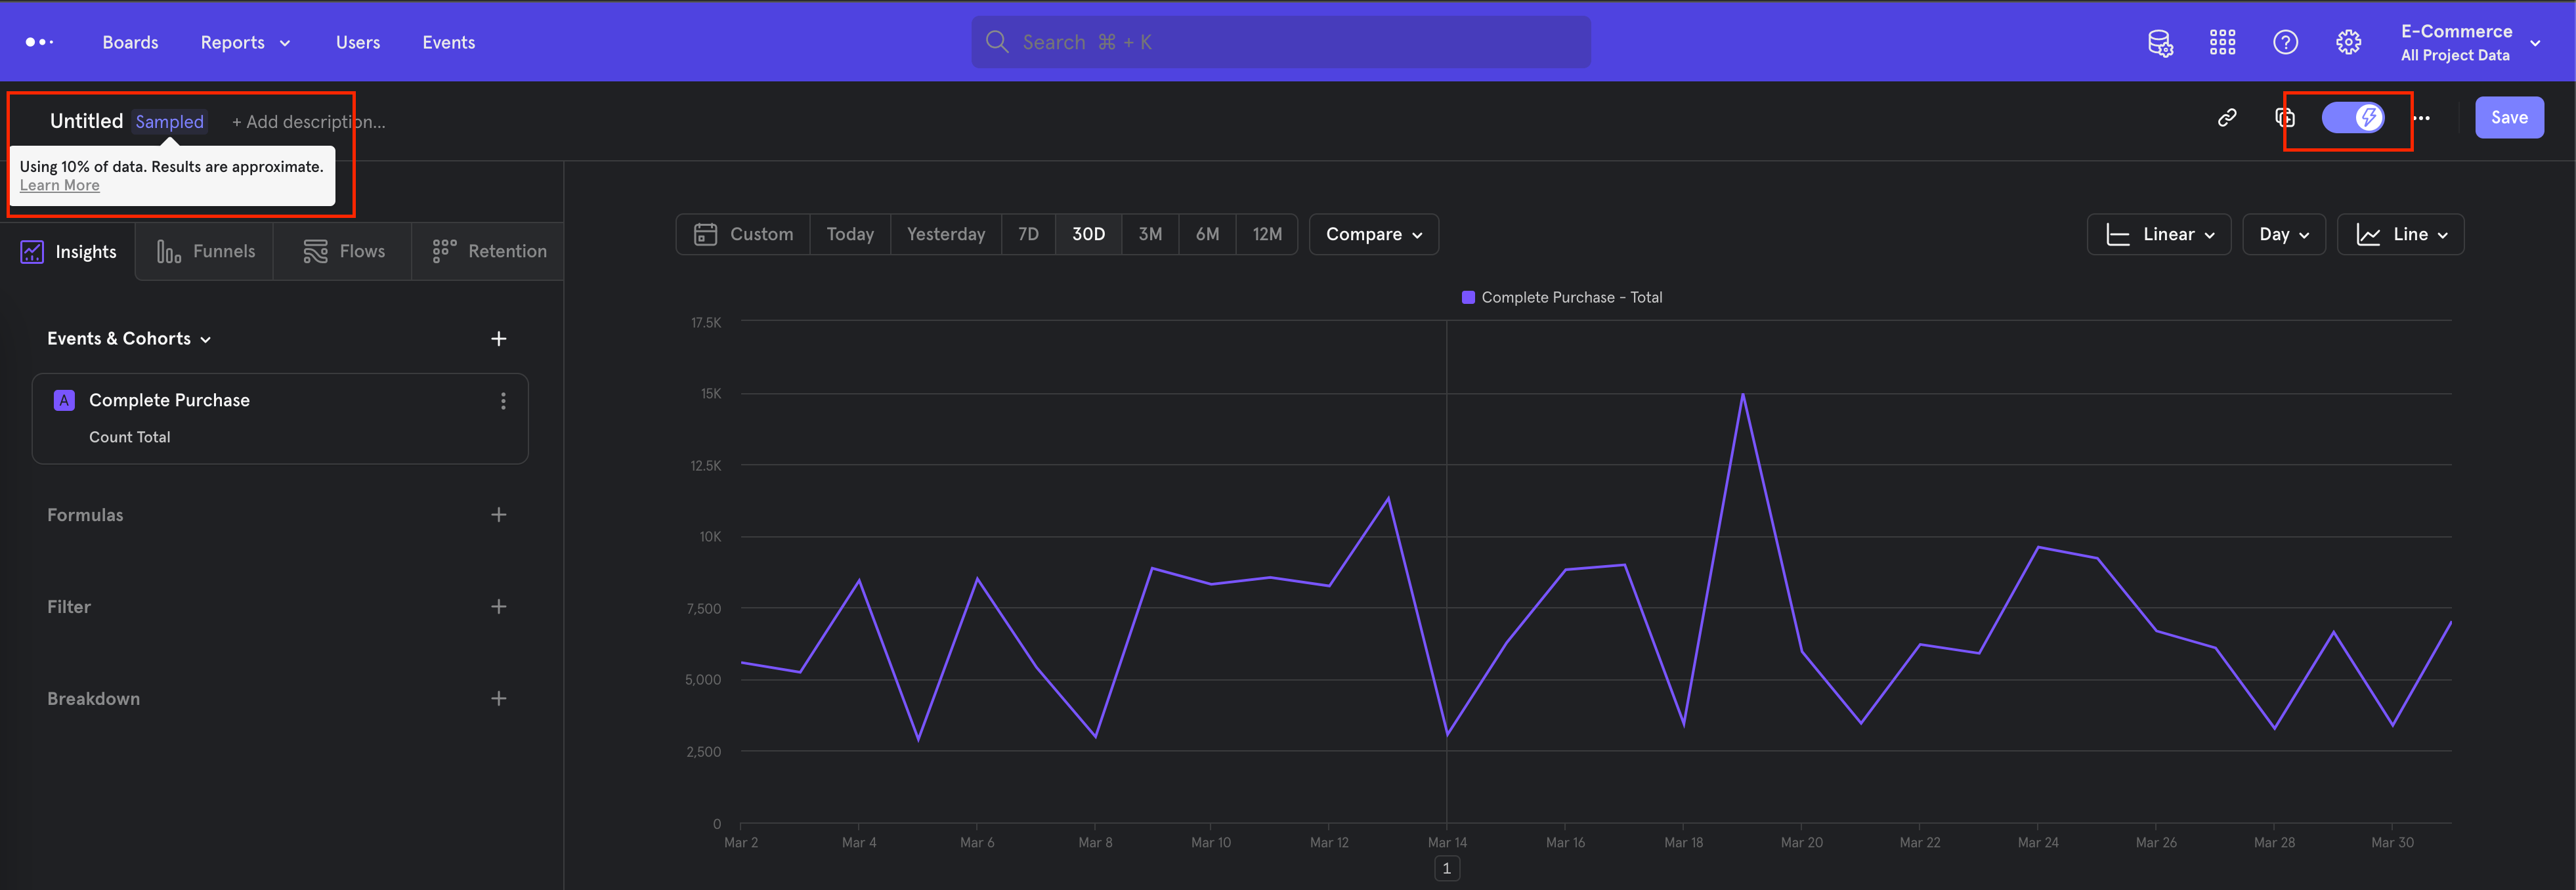
Query Time Sampling Calculation and Presentation
Mixpanel will not sample or drop events at ingestion. Instead, Mixpanel will ingest all event data and sample it at query time. This prevents the loss of important data and, therefore, allows you to toggle sampling on and off depending on need. For example, if you need iterative querying, then sampling will greatly speed up this process. When you build the proper query, you can turn off sampling and query the entire dataset. The following occurs when sampling is enabled:- Mixpanel selects a uniformly random sample of users on which to run the analysis.
- The sample size is 10% of the total population.
- The report is generated using that subset of users.
- Mixpanel up-samples the data by multiplying by the inverse of the sampling factor. This is done for functions such as totals and uniques. Functions that do not scale with users (average, min, max) will not be up-sampled.
- The effect is that numbers should closely approximate results seen without sampling enabled. This works better as the number of users increases, particularly for customers with more than 5 million users.
- Mixpanel adds an annotation to reports.
If you save a report that uses query time sampling, then a version of the report without sampling is saved. This ensures that boards and saved reports are computed on the entire dataset for high fidelity.
Query Result Caching
Mixpanel stores the results from a report query in our server cache and presents these results from there when appropriate. This saves time when running a complicated query multiple times, and allows you to surface previously calculated results near-instantaneously. The date range of the query will adjust how Mixpanel presents results from the server cache.- If the query date range is 1 year or over, then the query results are cached for up to 14 days.
- If the query date range is under 1 year, then the query results are cached for up to 7 days.
- If the query date range is under 6 months, then the query results are cached for up to 3 days.
- If the query date range is under 2 months, then the query results are cached for up to 2 days.
- If the query date range is under 1 month, then the query results are cached for up to 1 day.
- If the query date range is under 1 week, then the query results are cached for up to 12 hours.
- If the query date range is under 1 day, then the query results are cached for up to 1 hour.
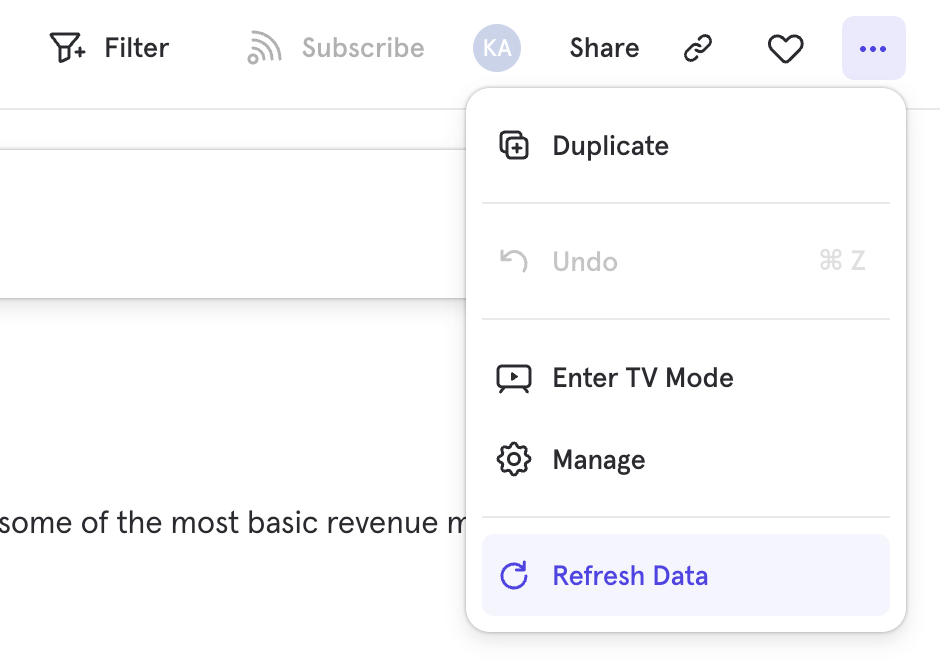
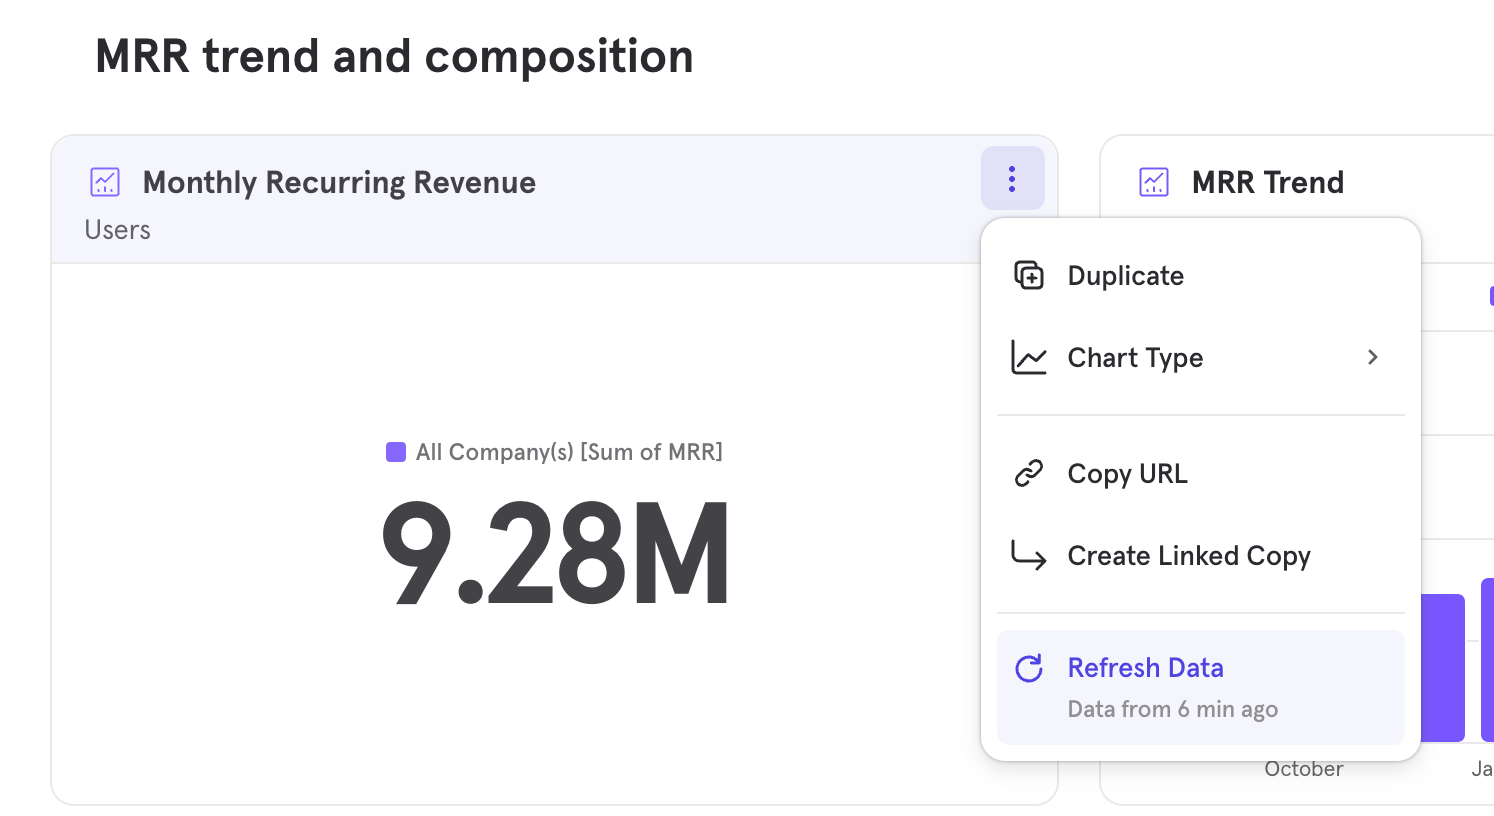
Refreshing the Query Results Cache
To refresh the query results cache, navigate to the report, click the three dots overflow menu at the top of the report and select Refresh Data.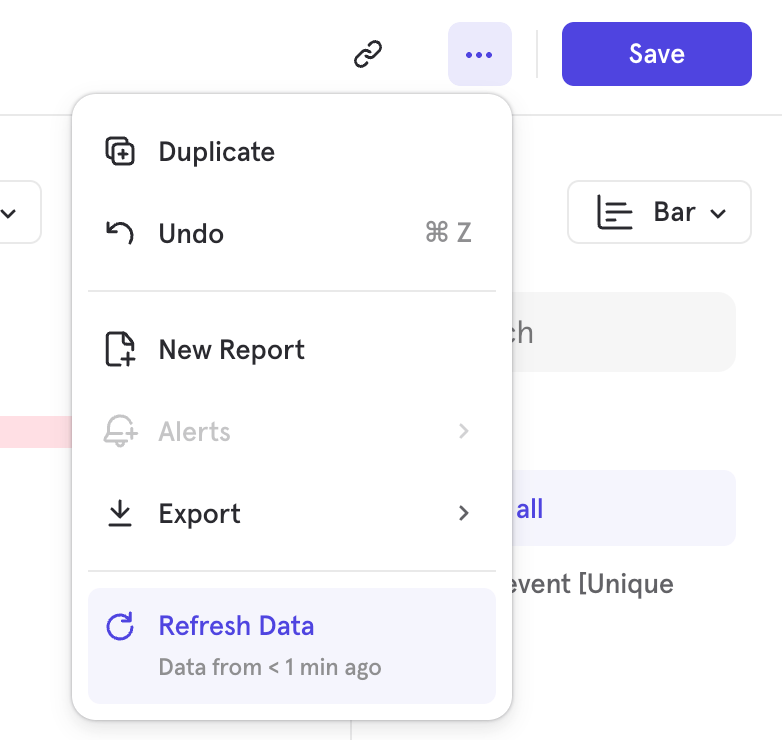
Find Interesting Segments
Determine which users are either driving conversion and retention or behaving as outliers by using the built-in “Find Interesting Segments” feature. Find Interesting Segments can help you discover:- Whether certain property segments outperform the overall funnel conversion or retention rates.
- Cohorts that perform best to optimize for those behaviors.
- Segments that are under-performing.
- Changes in the conversion or retention rates of segments.
- Change in population over time in funnels.
Interesting Segments in Funnels
View the top and bottom converting segments in your funnel by clicking the Find interesting segments button at the bottom of the segmentation chart.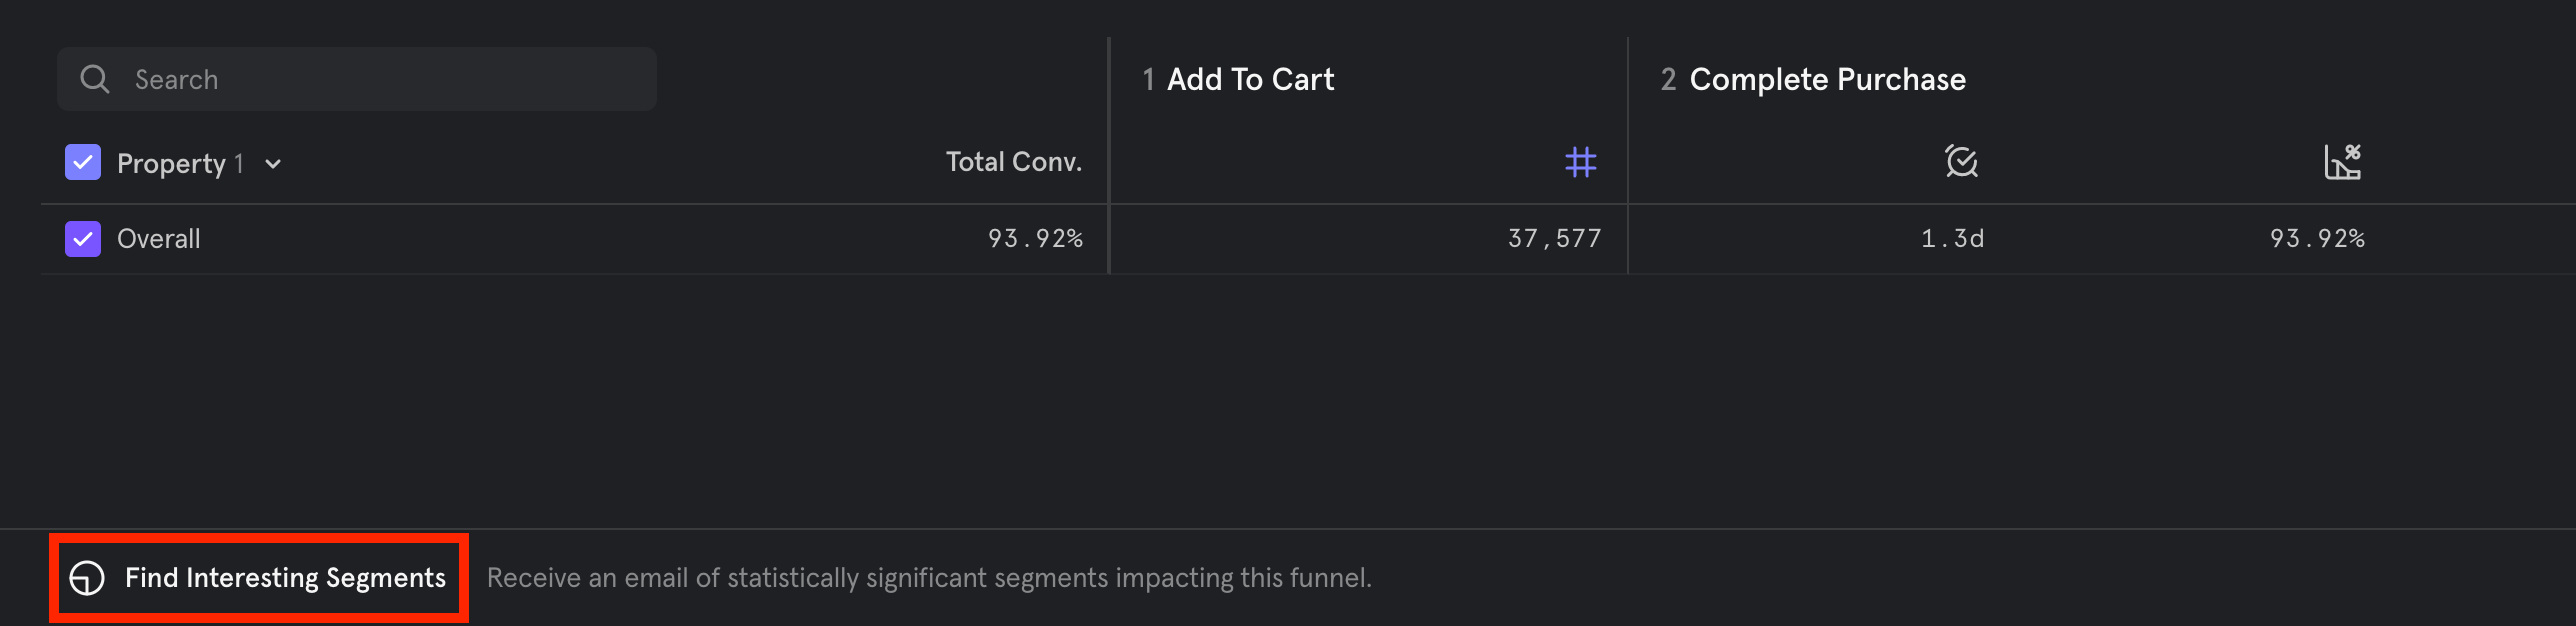
Segment Analysis
An email that breaks down the top and bottom converting segments of your funnel based on statistical significance and other factors is automatically sent after you click the button. If no statistically significant segments are found, then the email shows non-statistically significant segments. Segment Analysis helps answer questions such as:- Which groups of users are driving my conversion rate?
- Which groups of users are decreasing my conversion rate?
Time Comparison
A time comparison chart is also included in the email. This chart shows a segment’s behavior over time (in terms of both conversion rate change and population size change) as it relates to the overall population trend (population and conversion rate change). Time comparison answers questions such as:- Which groups of users are trending in a way that is different from the overall behavior?
- Which groups of users are driving the overall behavior?
Interesting Segments in Retention
View the top and bottom converting segments in your retention report by clicking the Find interesting segments button at the bottom of the retention chart. This feature is not currently available for Frequency Retention.