Users on a Growth or Enterprise plan can access the Impact report. See our pricing page for more details.
Overview
Mixpanel’s Impact report measures the effects of product or marketing launches on your key metrics. Impact calculates the user adoption of the launch, the impact of the launch on an important event, and the differences between users who adopt the launch and those who do not. To access Impact, go to the Applications section on the bottom left-side of the screen, and then select Impact.
Use Cases
Here are some of the sample questions you can answer in Impact:- How is the adoption of my feature changing over time?
- Did my feature launch affect the rate of another key value moment?
Quick Start
Step 1: Select a launch event
To build an Impact query, first select a launch event. This is the event that you are measuring as the cause of change.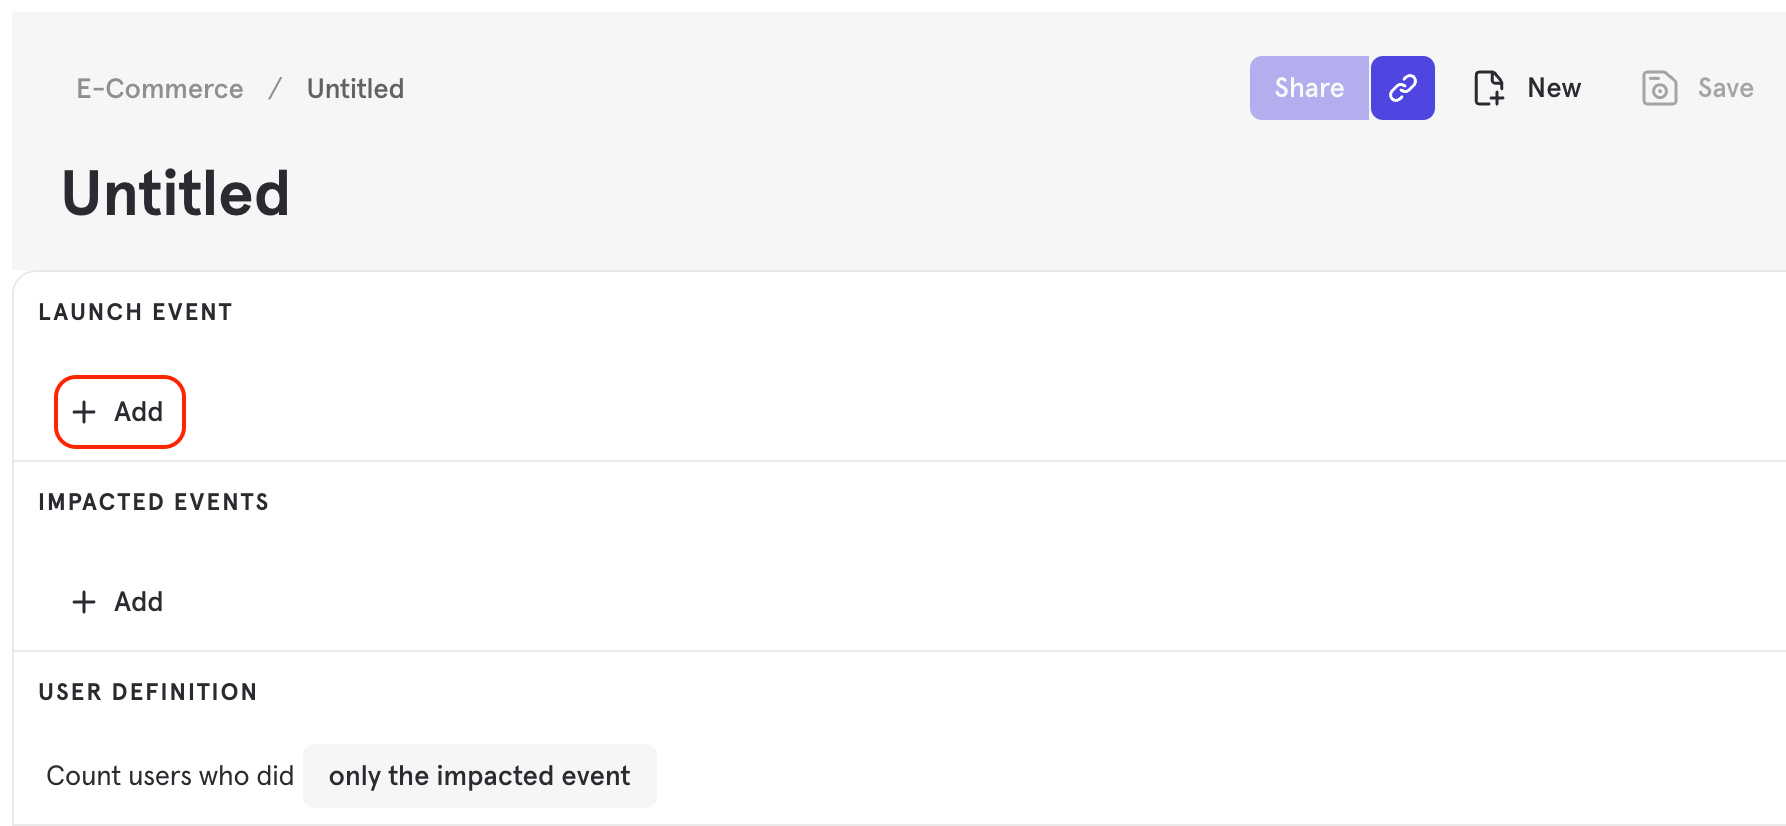
Step 2: Select metric events
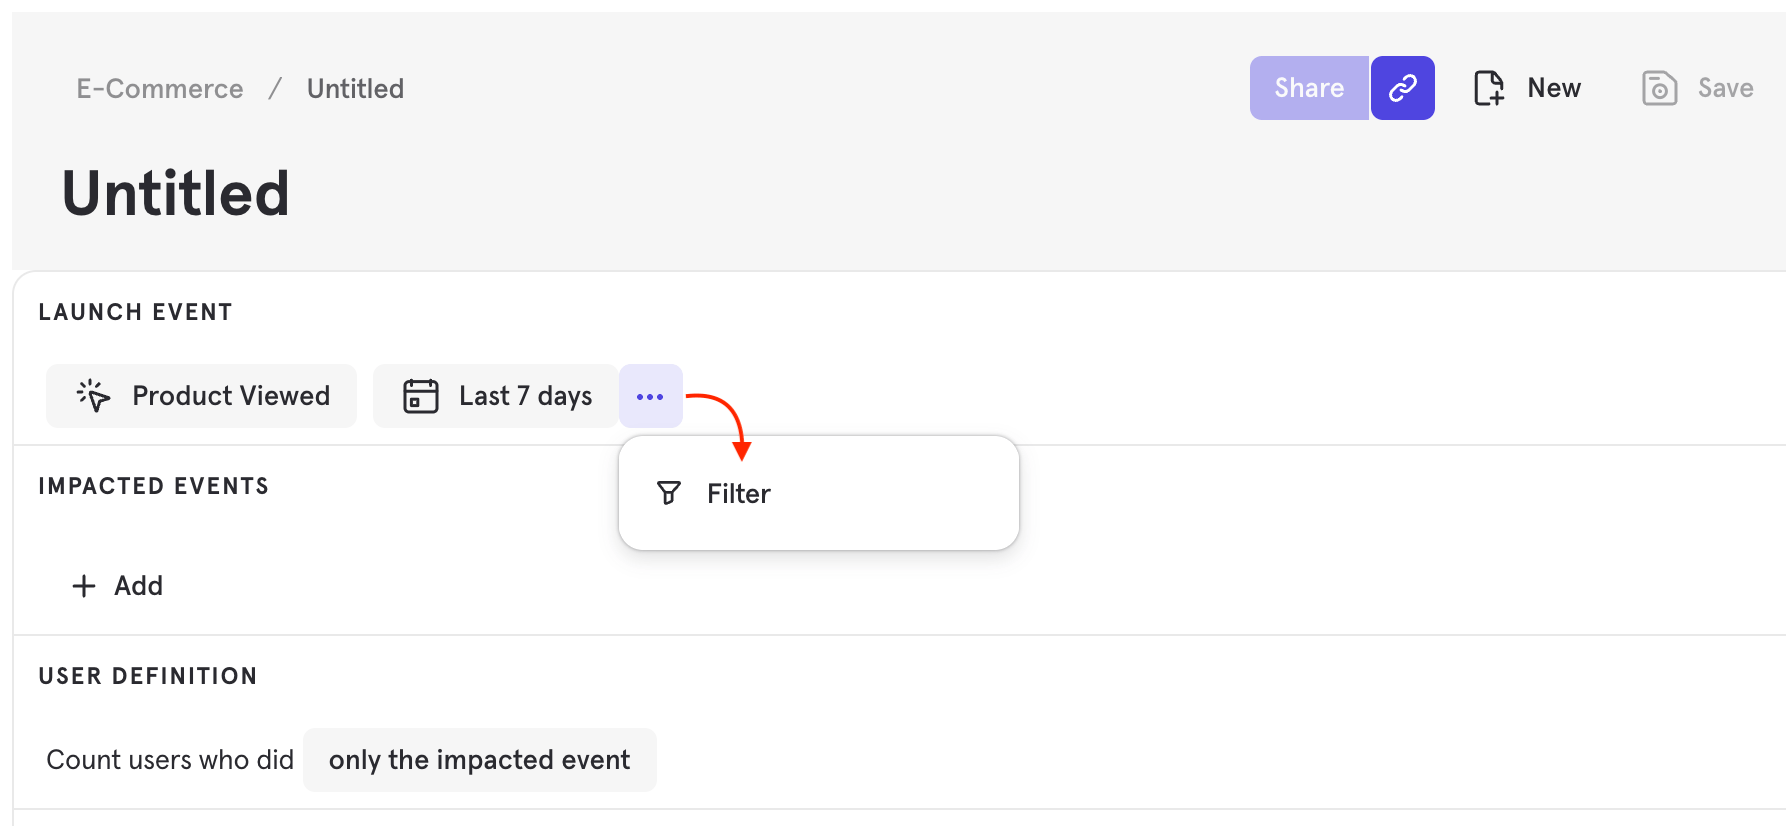
Select a metric event by clicking the Add button under IMPACTED EVENTS. You are measuring the impact of the launch event on this metric event. Add additional filters to narrow the impacted event parameters.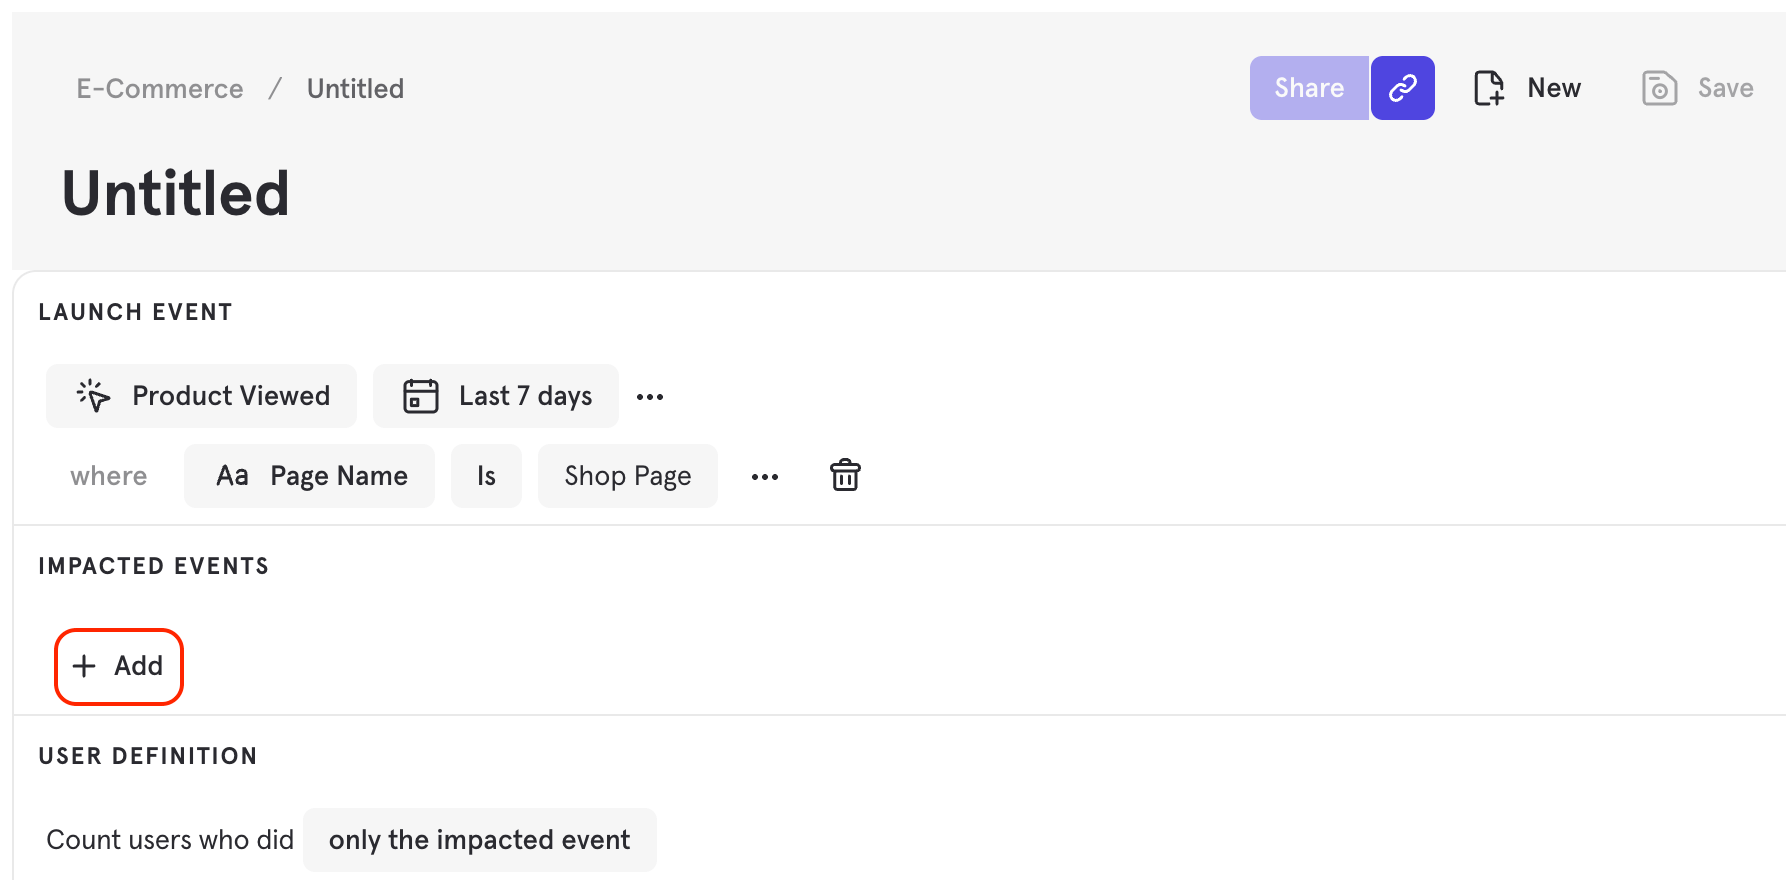
Step 3: Add breakdown (optional)
Breakdown impacted events further by clicking the ”…” icon, selecting Add Aggregation, and then selecting an event property, such as “Amount”. This will add up the value of this property for all of the times this event happened in this time range. All aggregate properties are typecast to numeric properties to calculate the sum of that property. For example, aggregate the property “Amount” under the event “Process Payment” to analyze revenue.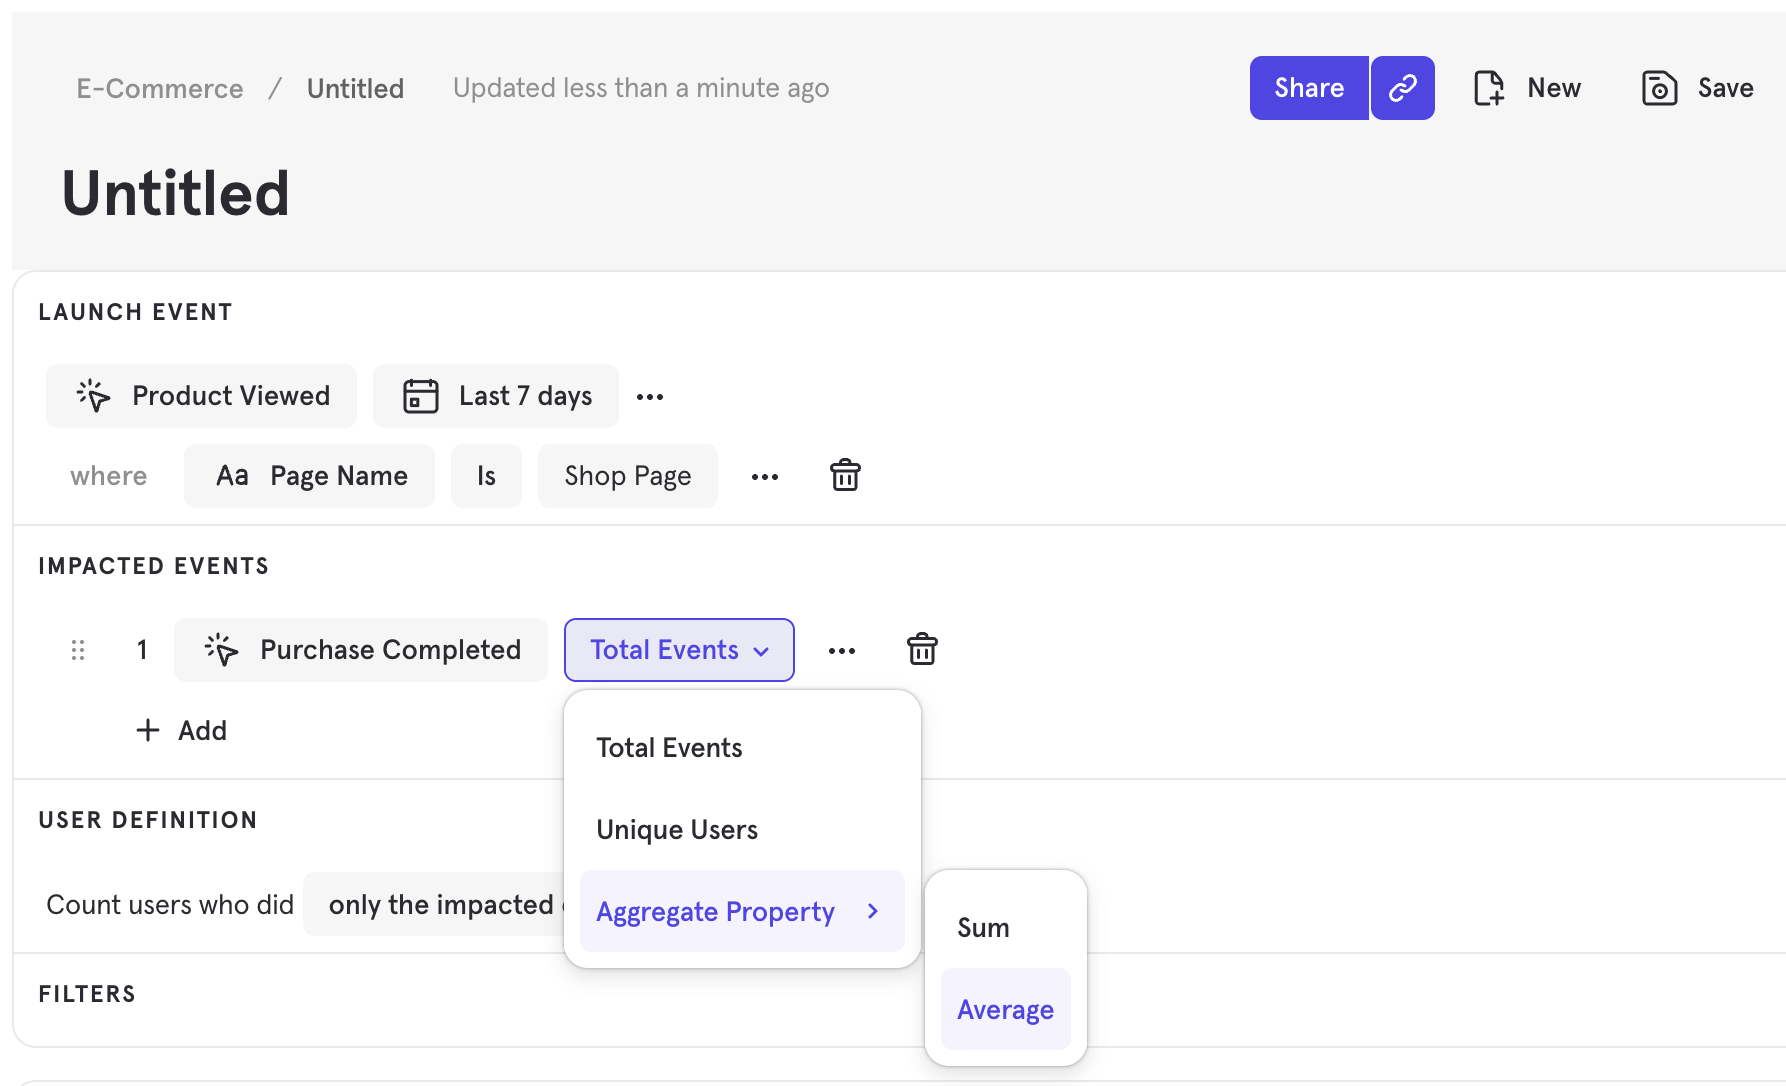
Step 4: Select user group
Under USER DEFINITION, select whether you would like to count users who did only the impacted event or any event.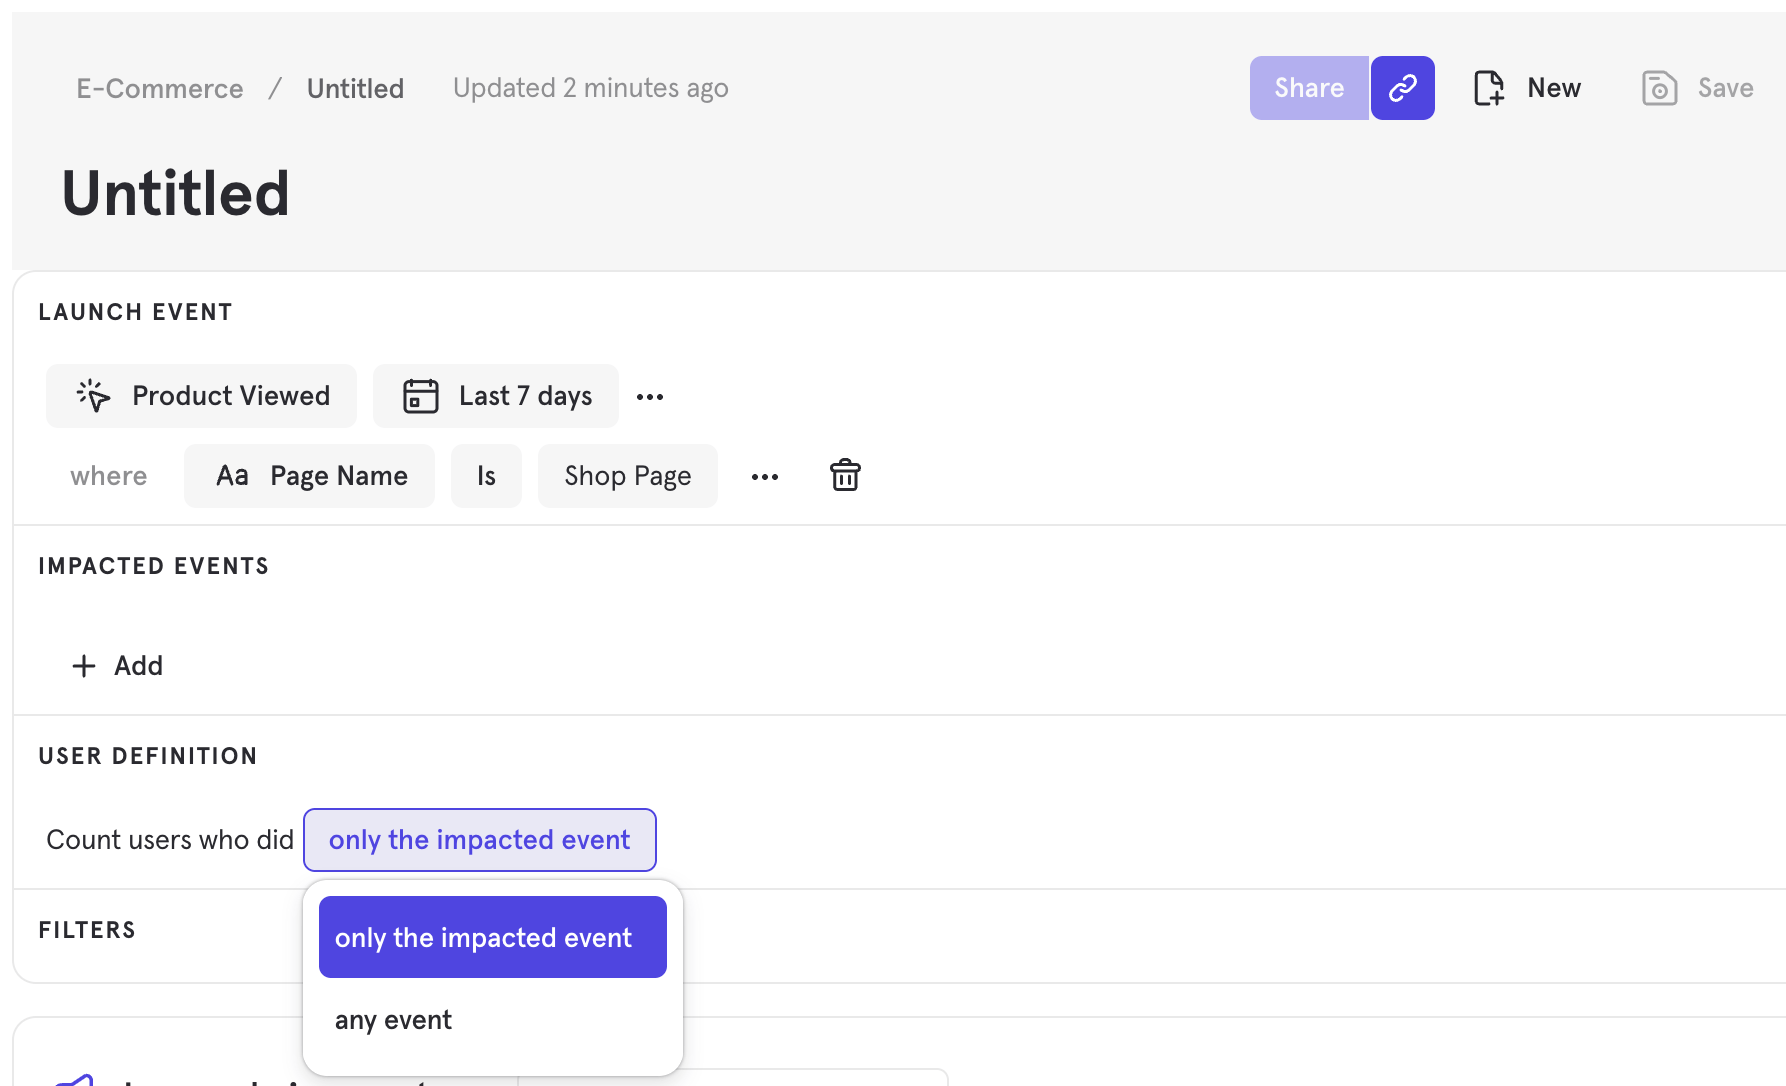
Step 5: Select time range
The time range is a fixed period of time that determines the adopters and non-adopters of the launch event. The default is “15 days before and after”, meaning that the 15 days preceding the fixed launch event date and the 15 days following the launch event will be included in the results. This will allow you to see the difference in the metric event before and after the launch event. The chart will not necessarily change if you change the time range.
Reference
Adoption
Adopters are users who have triggered the launch event. Non-adopters are users who haven’t triggered the launch event. Both adopters and non-adopters must perform the metric event to be included in the report. The Adoption Rate is the number of users who perform the launch event divided by the total user count:Impact Chart
The Impact Chart shows how the rate of metric event occurrence changes over time. The y-axis of the chart is the average number of the metric event’s count, and the x-axis is time spanning 30 days. Unlike other Mixpanel charts, the Impact Chart displays time in relative time, not calendar time. The chart centers around the first day that the launch event is available, or “day zero”. The chart displays the 15 days before and after day zero.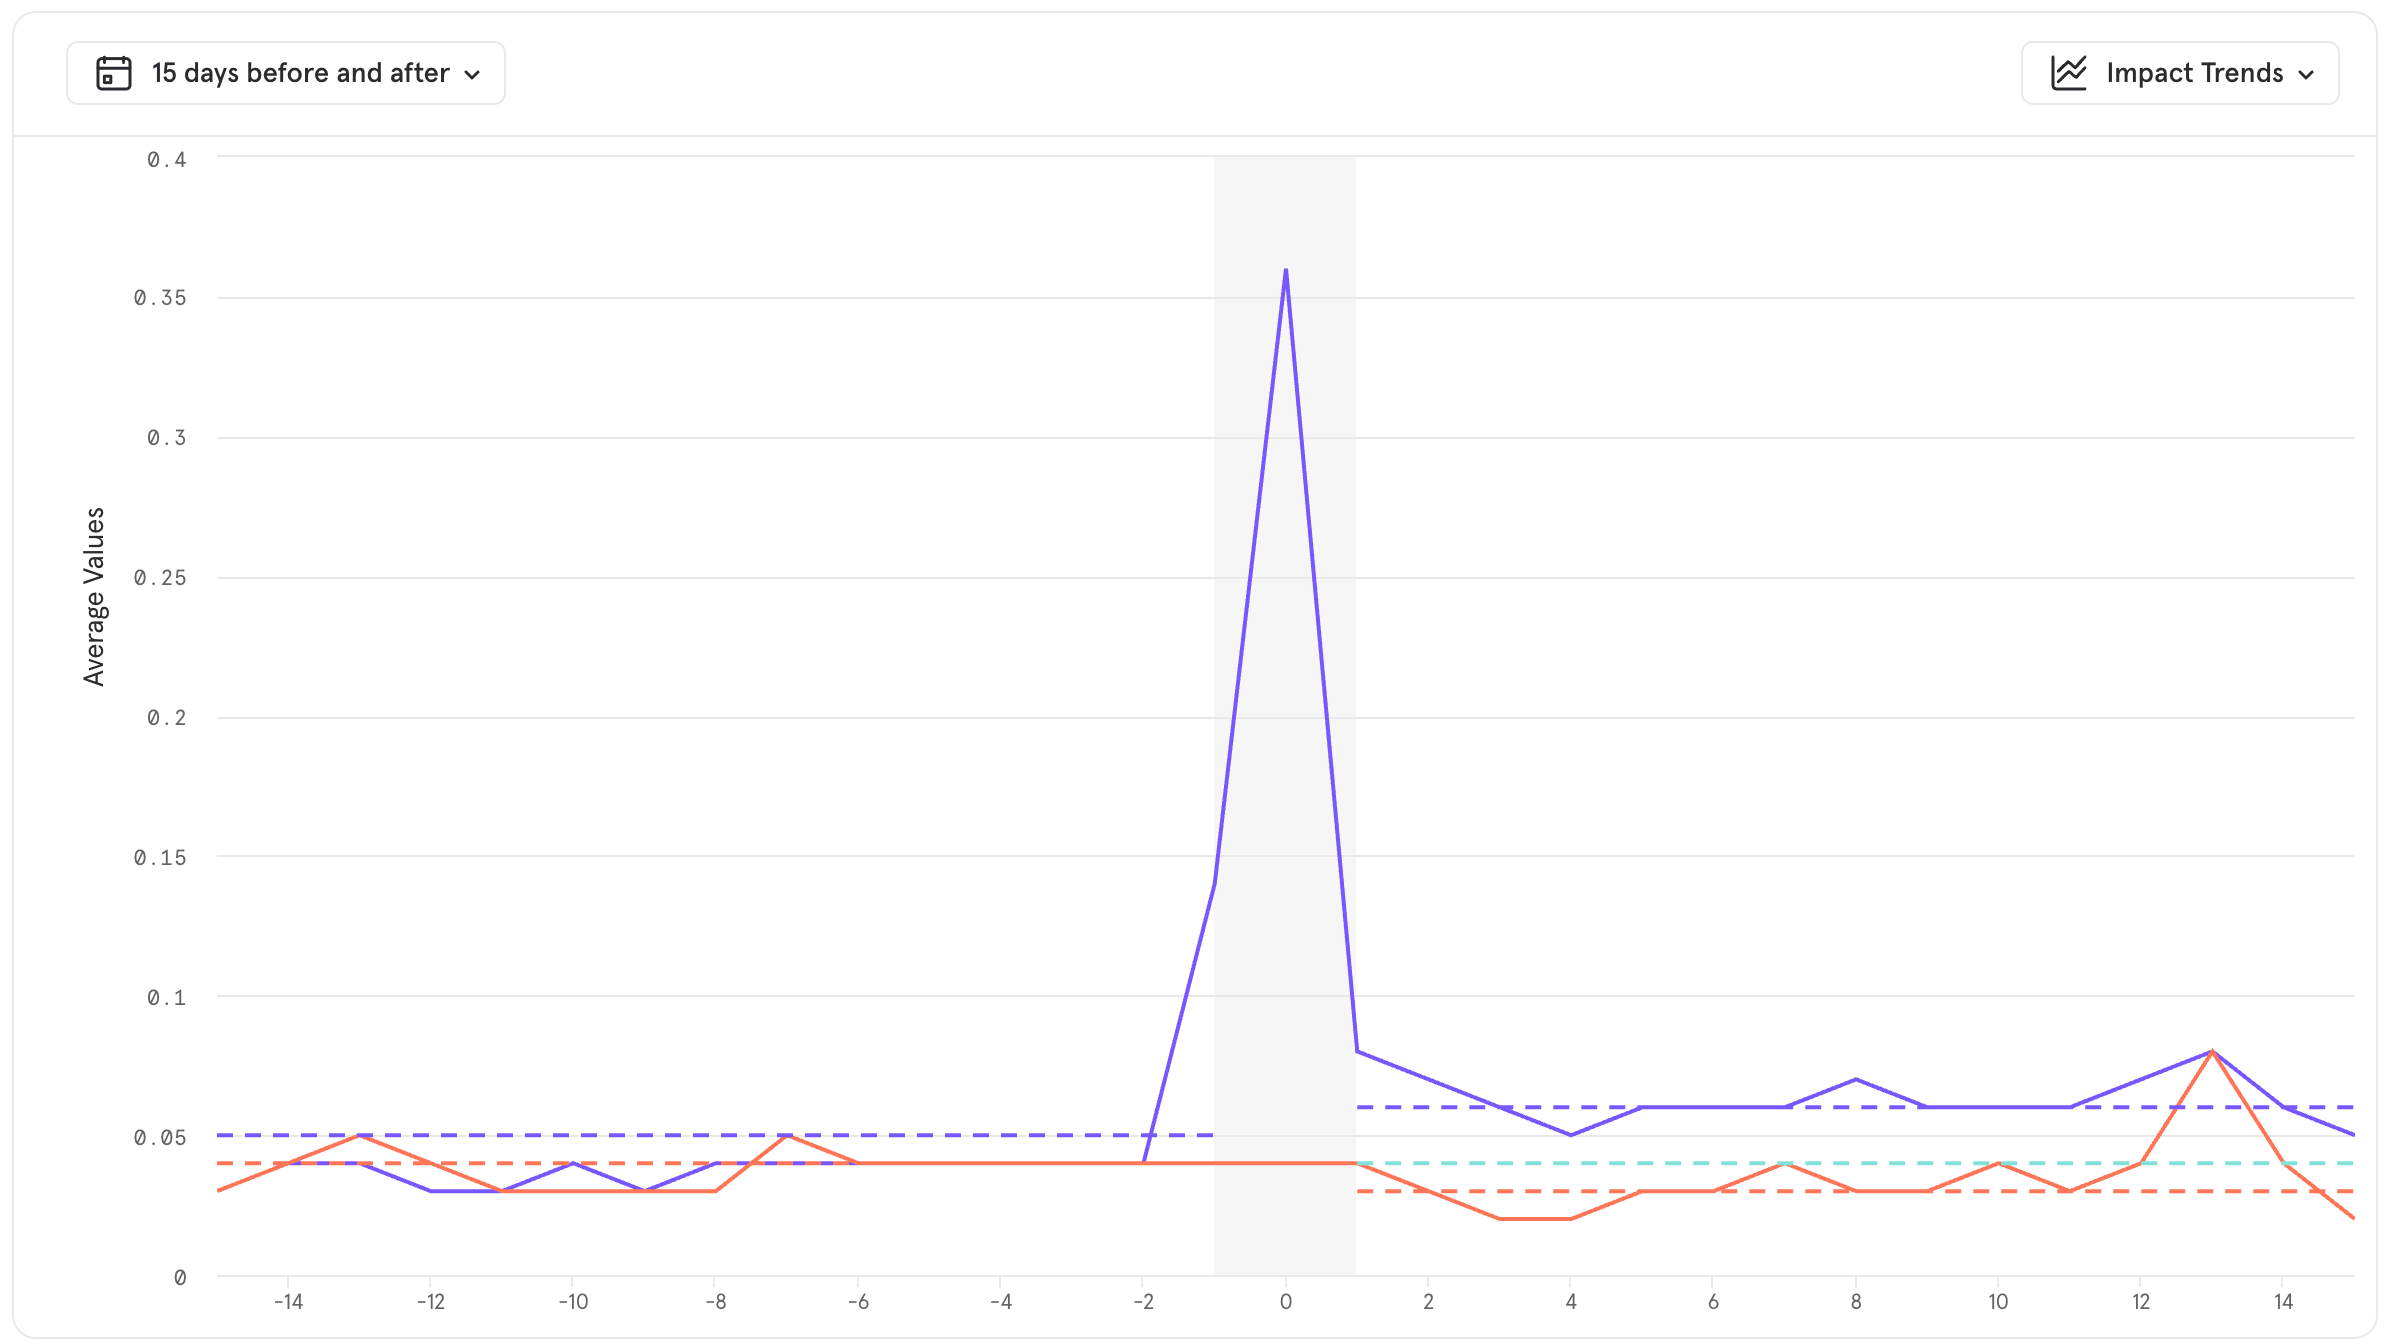
- 30 = The number of metric events performed by the adopters on day 5.
- 10 = The number of users who did the launch event 5 days before the first day.
- 3 = 30/10.
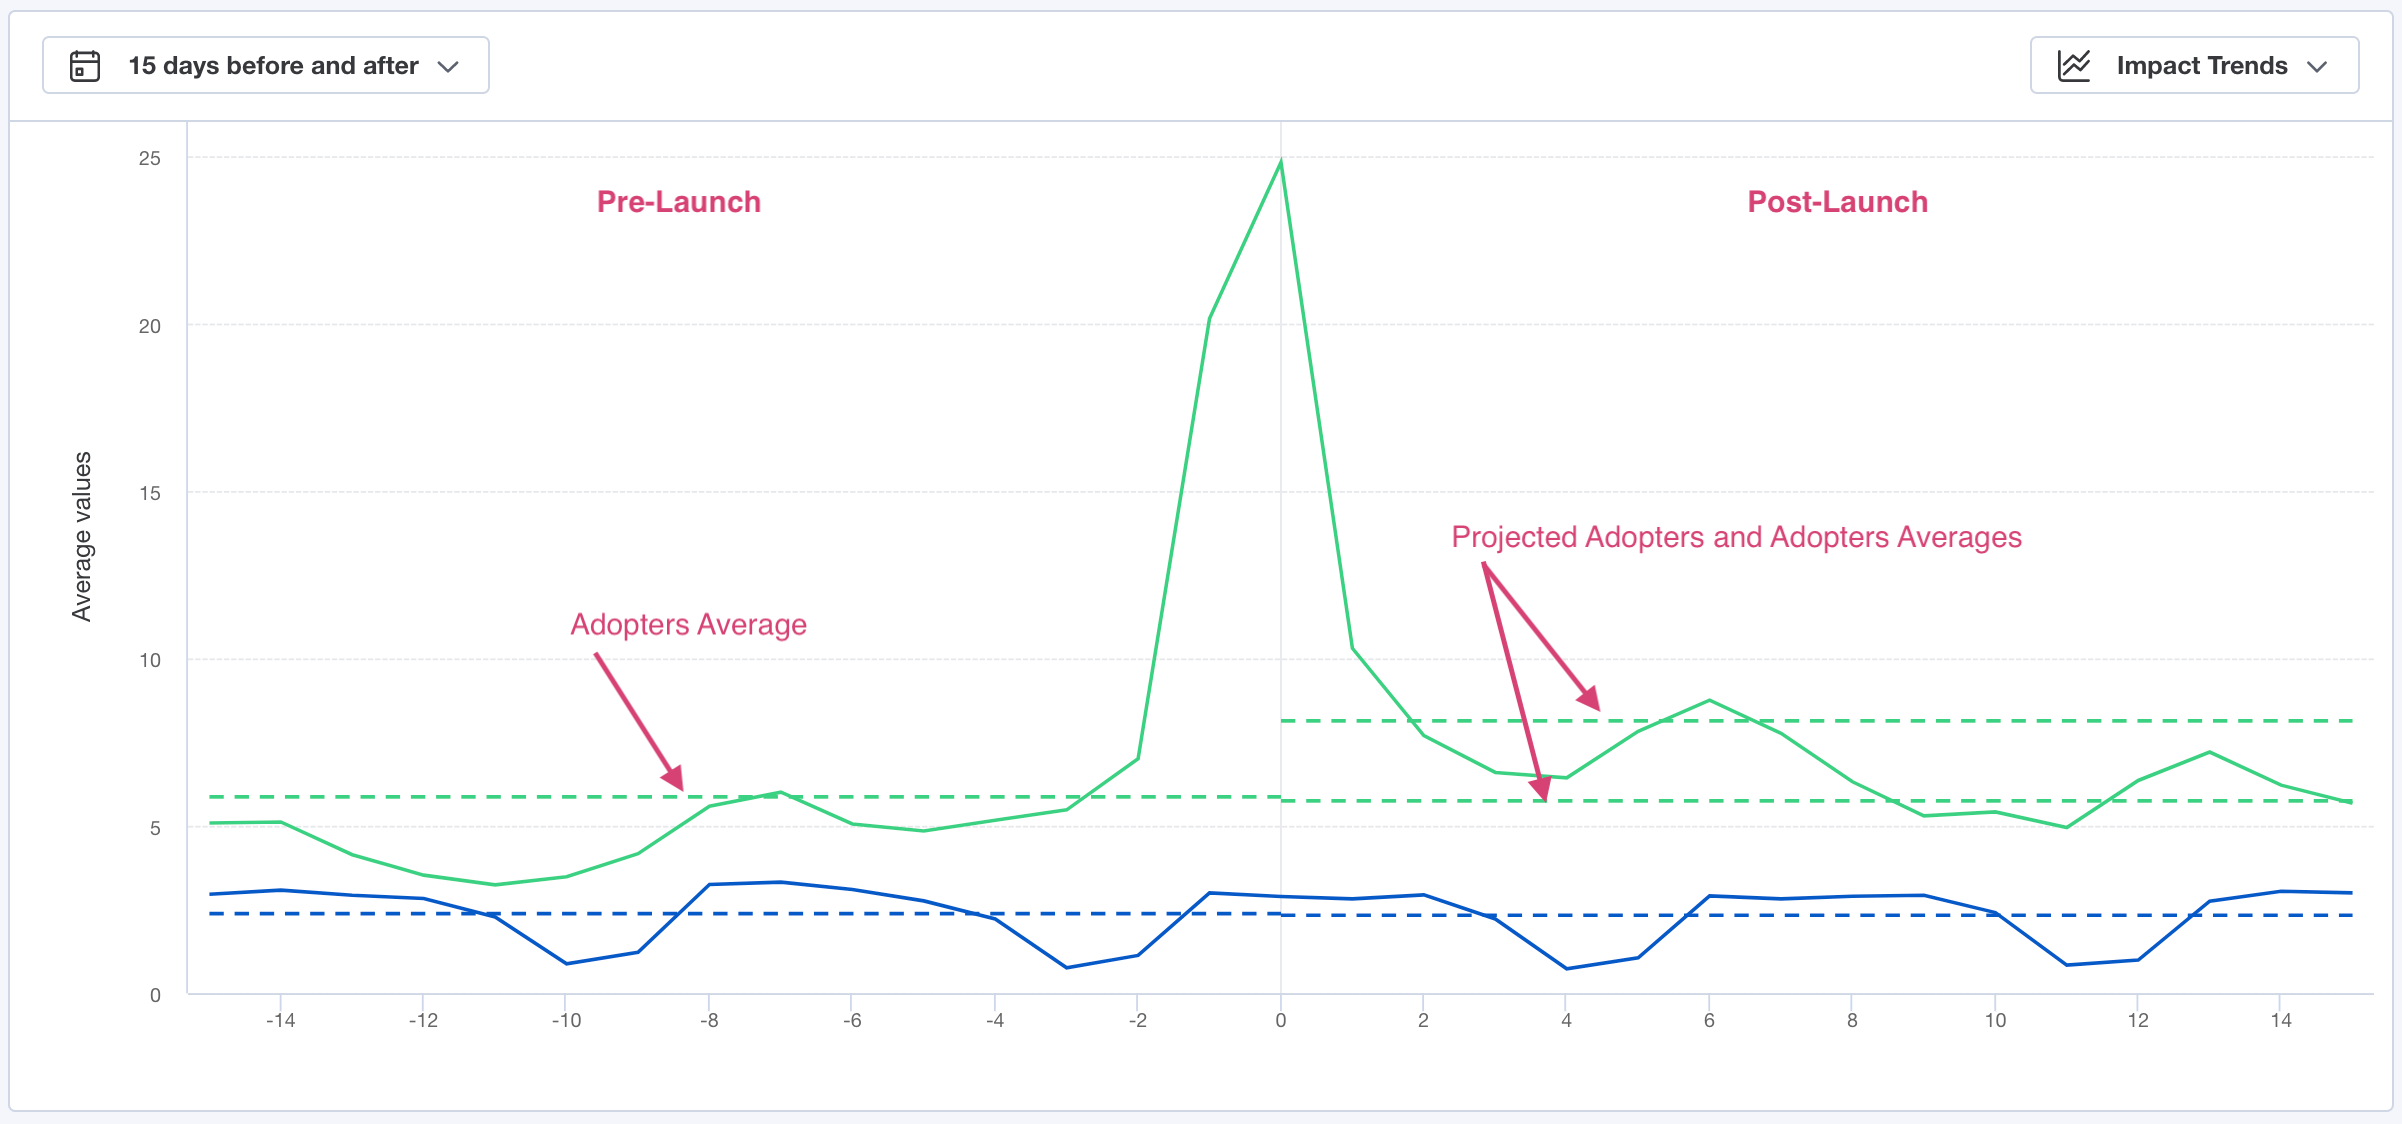
Impact Table
The Impact Table summarizes the results of the Impact chart. It displays the average rate at which users in the adopter and non-adopter groups performed the metric event over the course of the 15 days before and after launch. The table is broken down into three sections: “Pre-Launch”, “Post-Launch”, and “Impact”.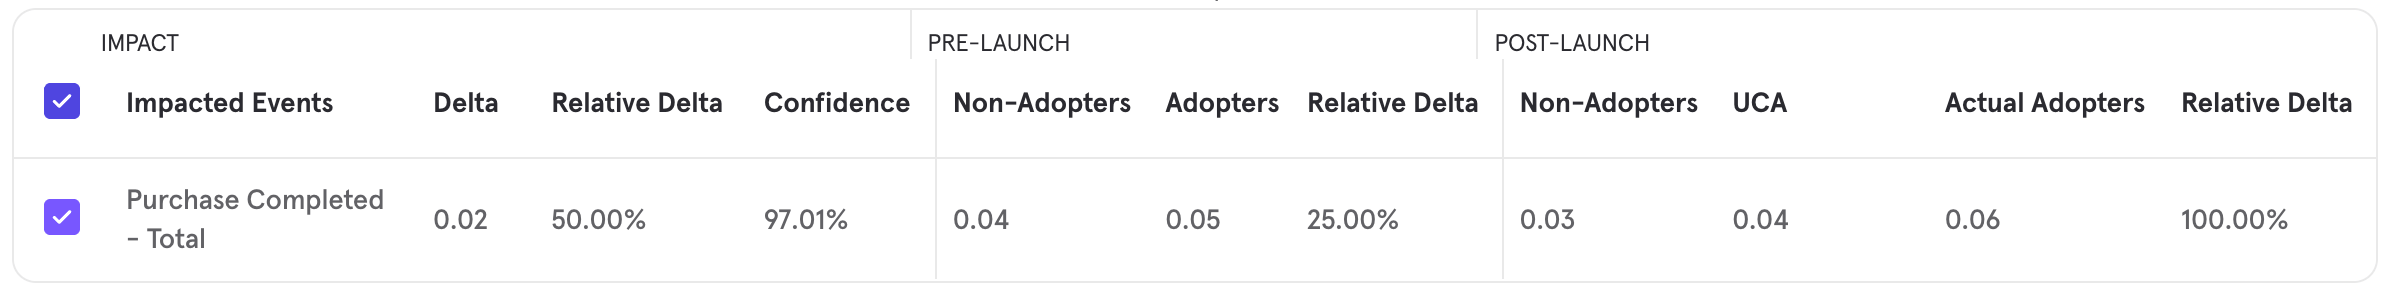
Pre-Launch
The Pre-Launch section contains columns for adopters, non-adopters, and the relative delta between them. Adopters are users who perform the launch event after launch, and non-adopters are users who do not perform the launch event after the selected launch date. The relative delta is calculated using the equation:Post-Launch
The Post-Launch section contains columns for actual adopters, non-adopters, unobserved counterfactuals of adopters, and the relative delta between them. Adopters are users who perform the launch event, and non-adopters are users who do not perform the launch event after the selected launch date. The UCA value is the projected behavior of adopters if the launch event never happened. This calculation controls for any difference between the adopters and non-adopters that is not a result of the launch event. This value is calculated by the following, where NA is non-adopters, pre is pre-launch, and post is post-launch: The relative delta is calculated using the equation:Impact
The Impact section of the table contains the final calculations that indicate if and by how much the launch event affected your impacted metrics. These calculations are the delta, the relative delta, and the confidence score. The delta is the difference between the UCA and adopters in the post-launch period. The relative delta divides that value by the UCA. Confidence indicates the statistical significance of the report calculations. See below for details on the calculation of confidence.Interpret the Results
In general, when the overall delta is positive and the confidence score is 95% or more, it indicates a successful launch. The most successful launches will see the rate at which adopters perform the metric event increase post-launch, while the same rate for the non-adopters remains relatively constant. In the Impact Chart, look at the average gap in usage between the adopters and non-adopters. Typically, it is preferable for the increase in the gap to be mostly driven by an increase in the rate at which adopters perform the metric event, rather than a decrease in the rate at which non-adopters perform it.Confidence Calculation
Impact includes confidence to indicate the statistical significance of the report calculations. Interpret the confidence as the probability that the final delta is primarily caused by the launch event, as opposed to existing by chance. The confidence is calculated as a confidence interval using a cumulative distribution function while assuming a normal distribution. The confidence variables are as follows:- X = The number of events per day performed by adopters in the pre-launch period.
- Y = The number of events per day performed by adopters in the post-launch period.
- A = The number of events per day performed by non-adopters in their pre-launch period.
- B = The number of events per day performed by non-adopters in their post-launch period.
- Y - X = The difference in the number of events per day performed by adopters between post-launch and pre-launch periods.
- B - A = The difference in the number of events per day performed by non-adopters between the post-launch and pre-launch periods.
- The mean of Y - X over time is denoted by:
- The mean of B-A over time is denoted by:
- The standard deviation of Y - X over time is denoted by:
- The standard deviation of B - A over time is denoted by:
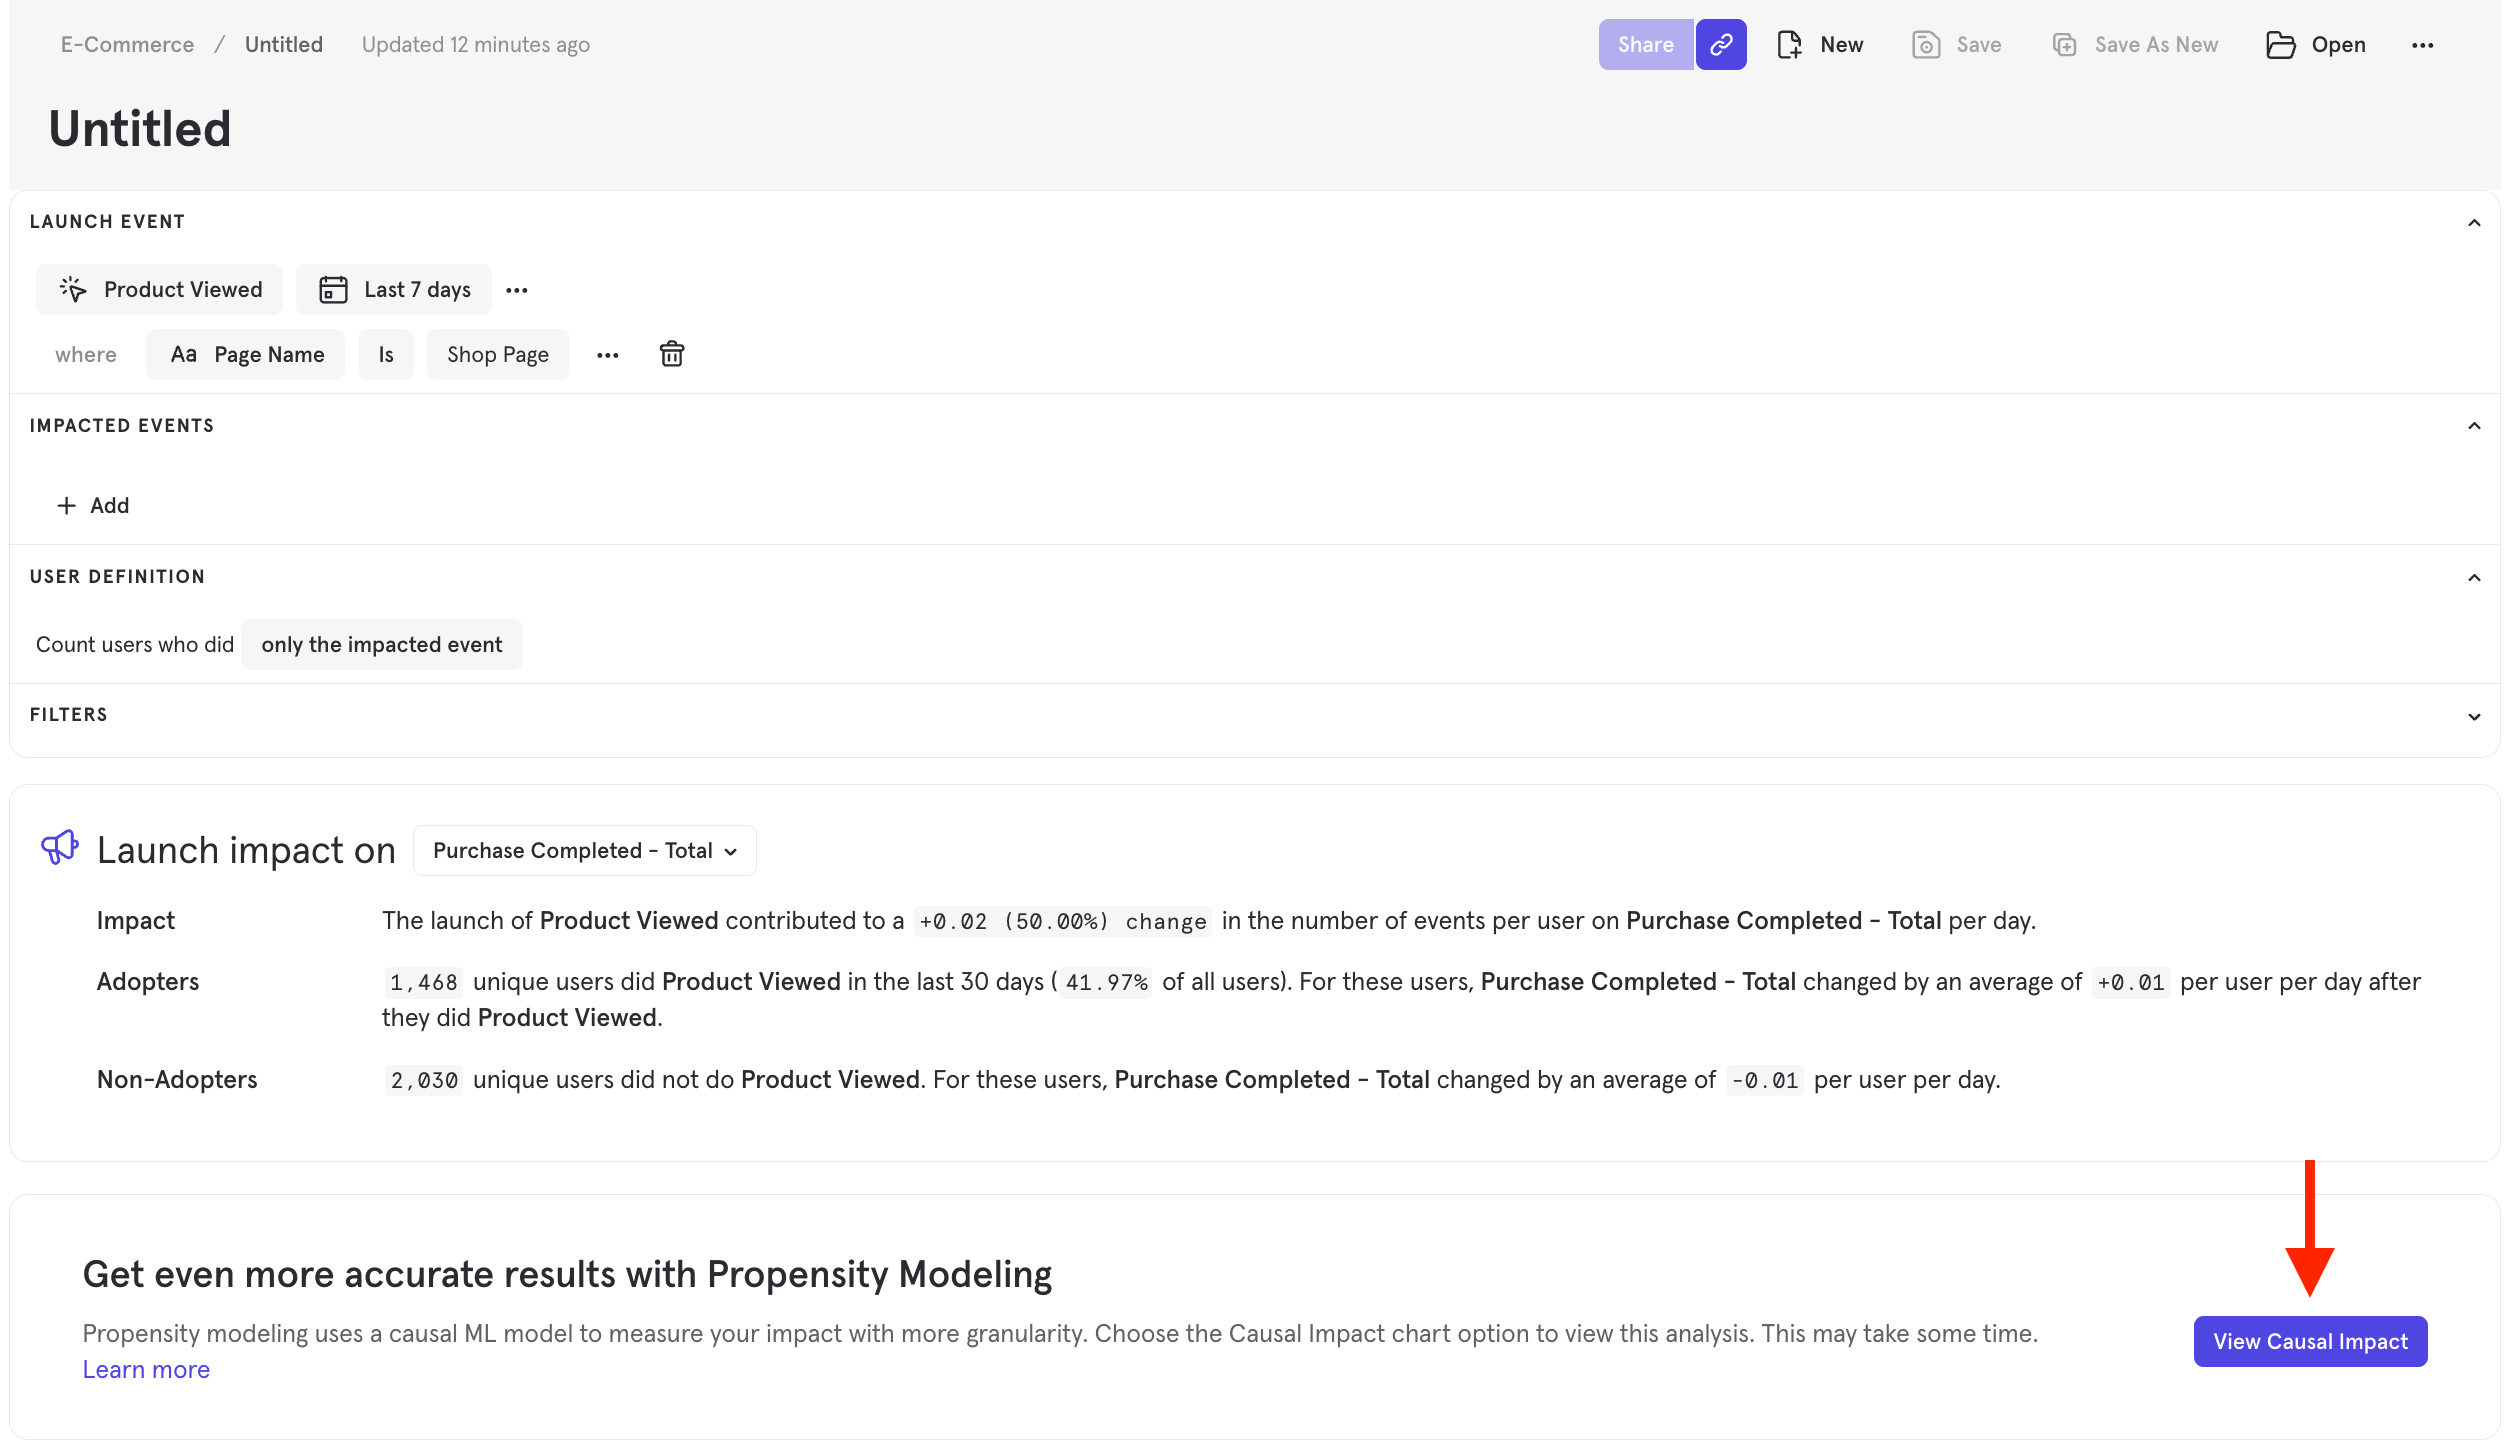
Causal Impact
Causal impact uses propensity score methods (a class of causal inference techniques) to refine Impact report results by controlling for self-selection bias. Self-selection bias refers to the tendency of active users to be likely to use your new feature and to perform the impacted metrics, independent of the launch. Propensity score methods control for self-selection bias by simulating what would occur in a hypothetical, randomized A/B test. Propensity scores are estimated using L2-regularized logistic regression. Features are selected via chi-square feature selection, zero-imputed for missing values, and users without any feature data are excluded. To learn more about Causal Impact in detail, read this Mixpanel Whitepaper. Click View Causal Impact to use the propensity matching model.