Users on an Enterprise plan can access the Signal report. See our pricing page for more details.
Overview
Signal measures the association between a correlation event and a goal event and quantifies the correlation between the two. This facilitates a deeper understanding of the behaviors that drive customer conversions, and can help guide product decisions.Use Cases
Using an a music sharing application as an example can highlight the value of quantifying correlations between events. The music sharing app may want to understand the correlation between top events and users who purchase a song on the app. It is important to understand what the optimal actions that users take before purchasing a song are. Building this query in Signal would involve selecting the target users, and how the “Song Purchased” goal event is correlated with the top events.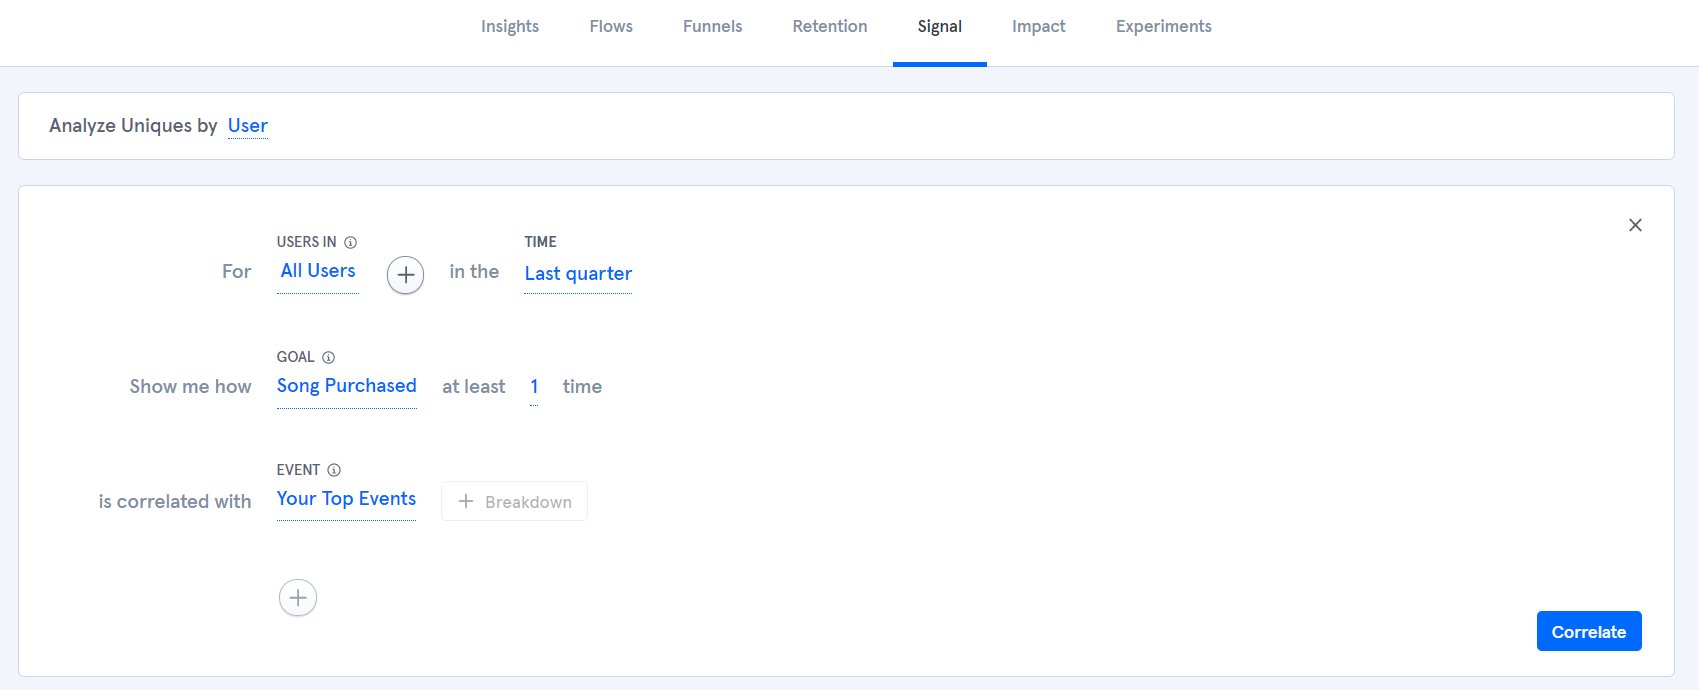
Quick Start
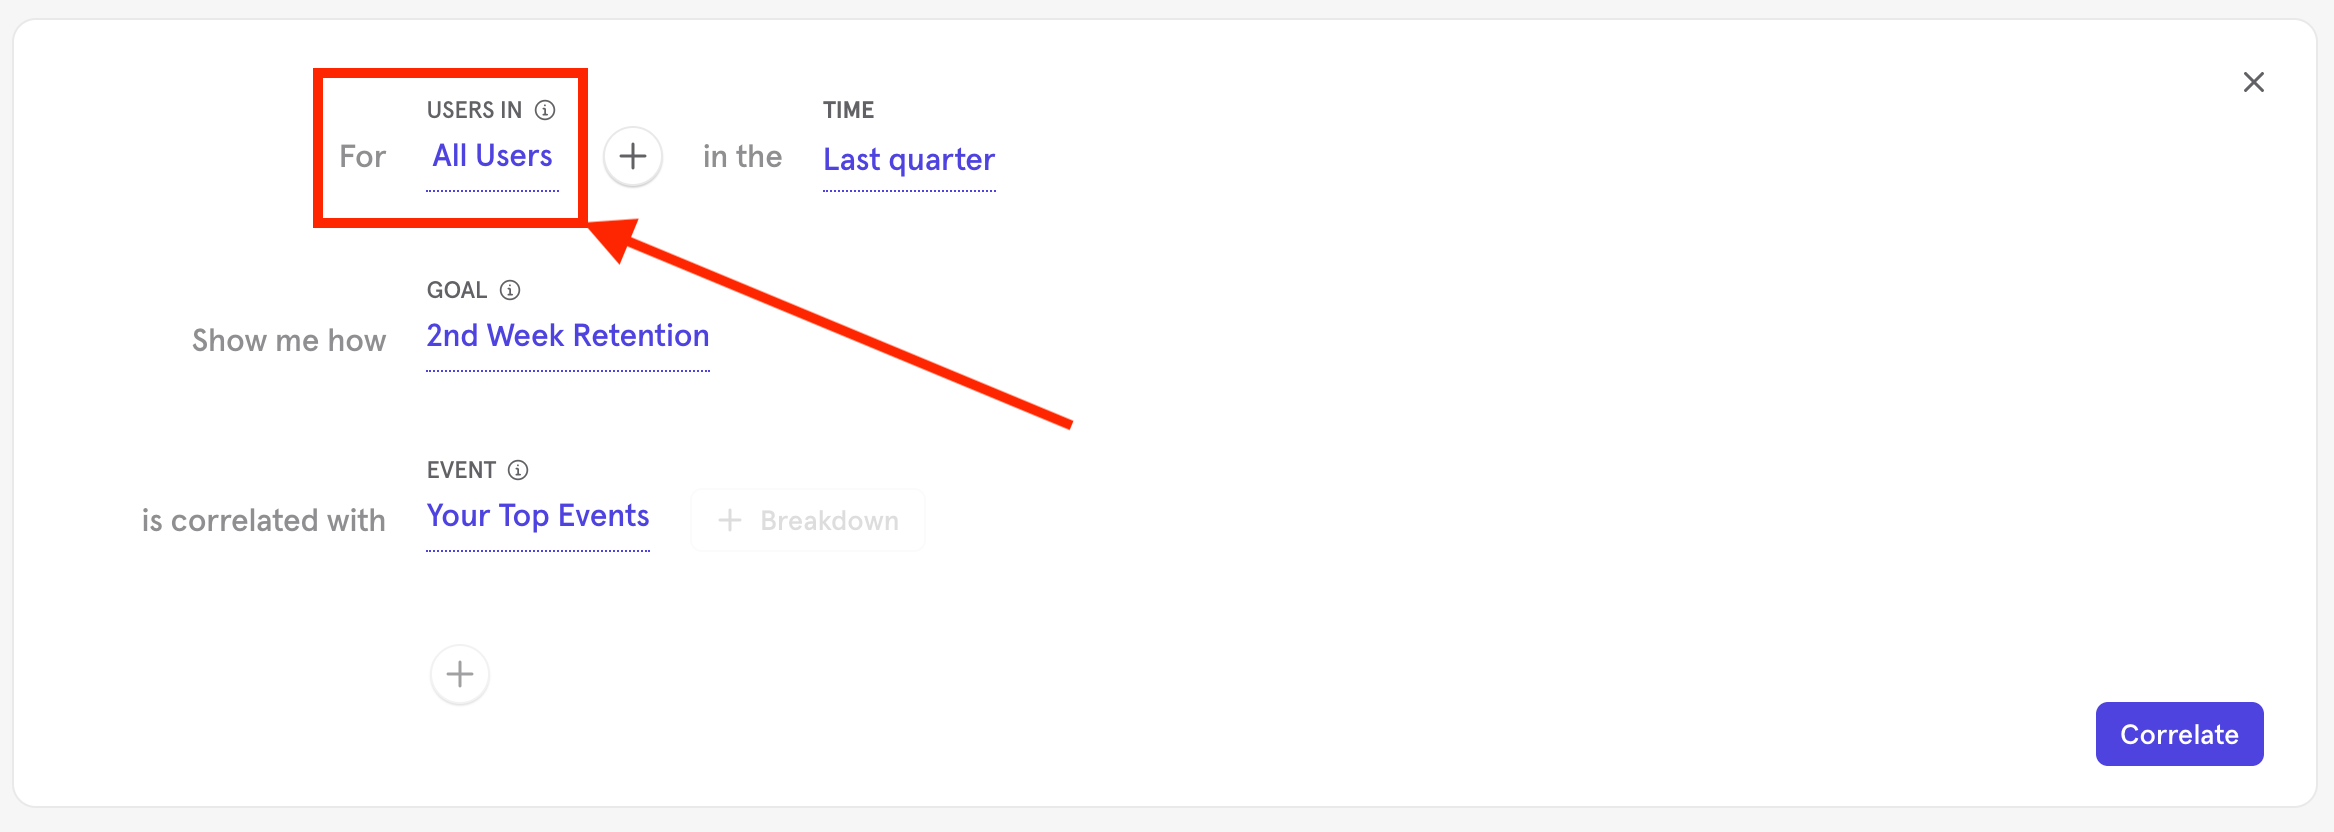
- Determine and specify the target users. “All users” is the default.
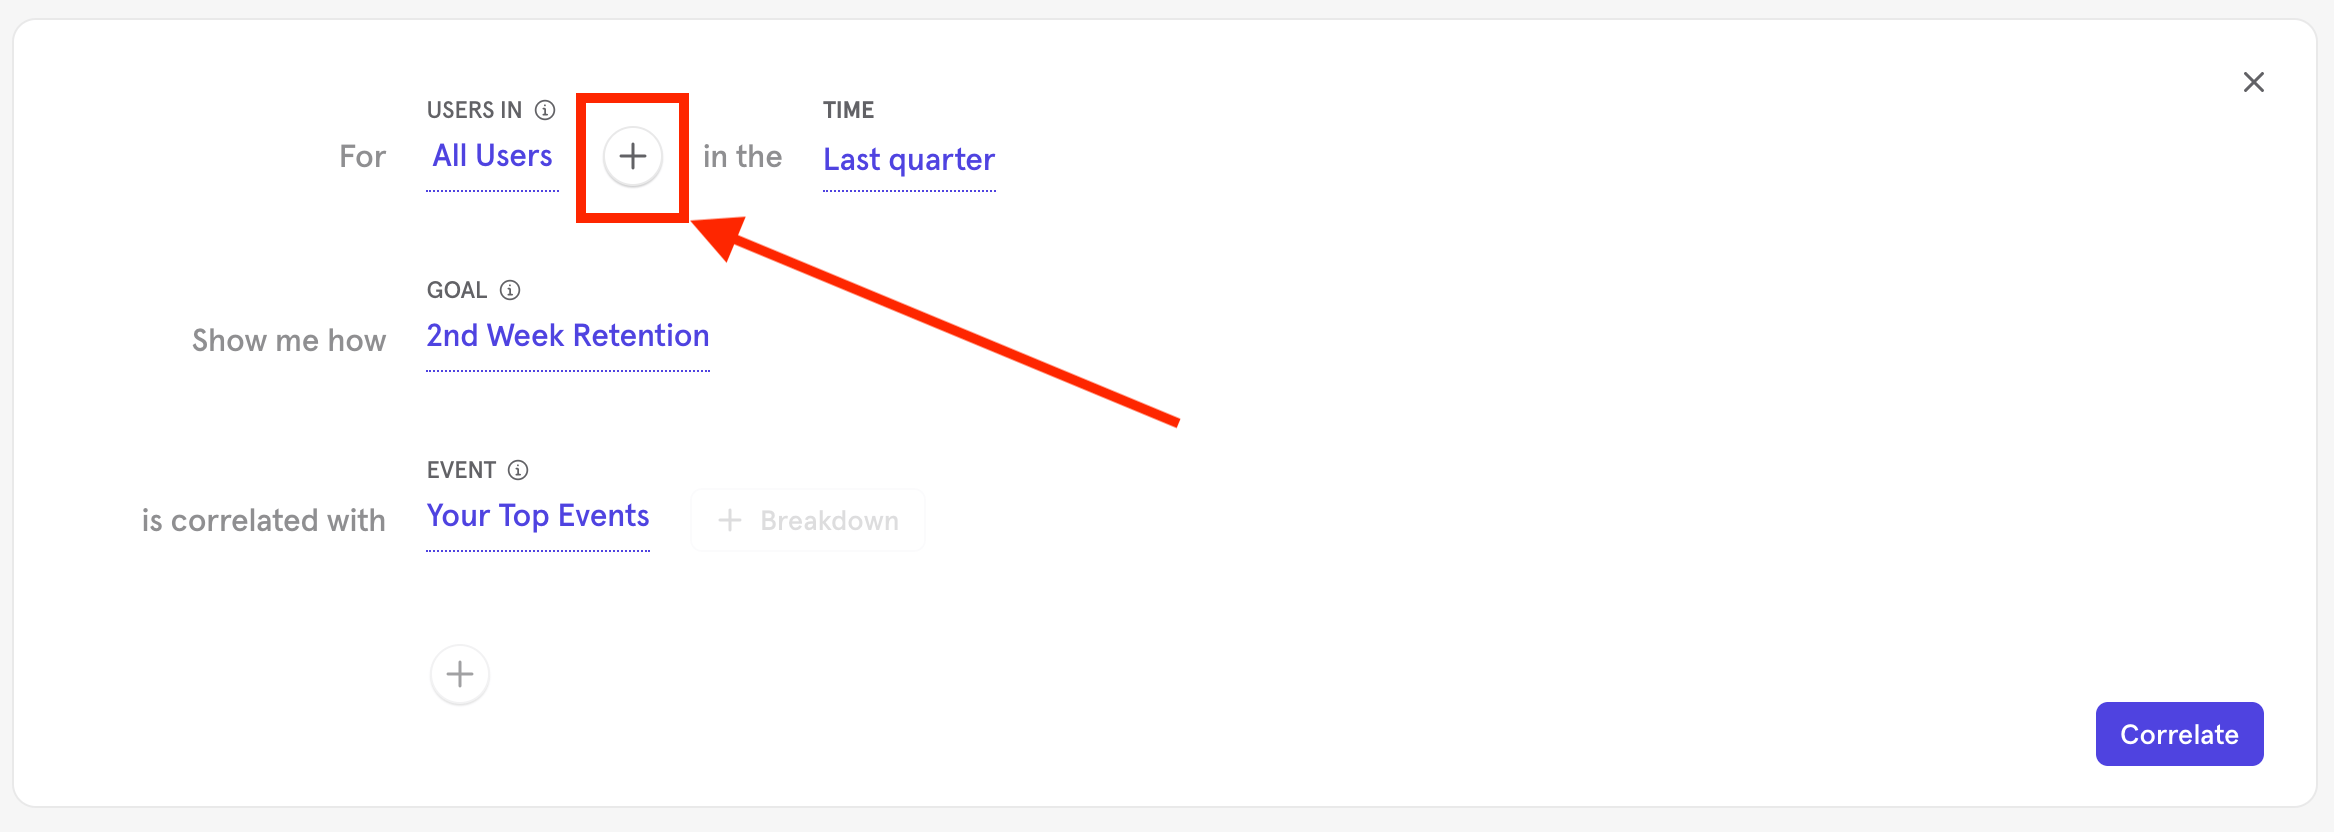
- Select any event performed by the target user by clicking the + sign.
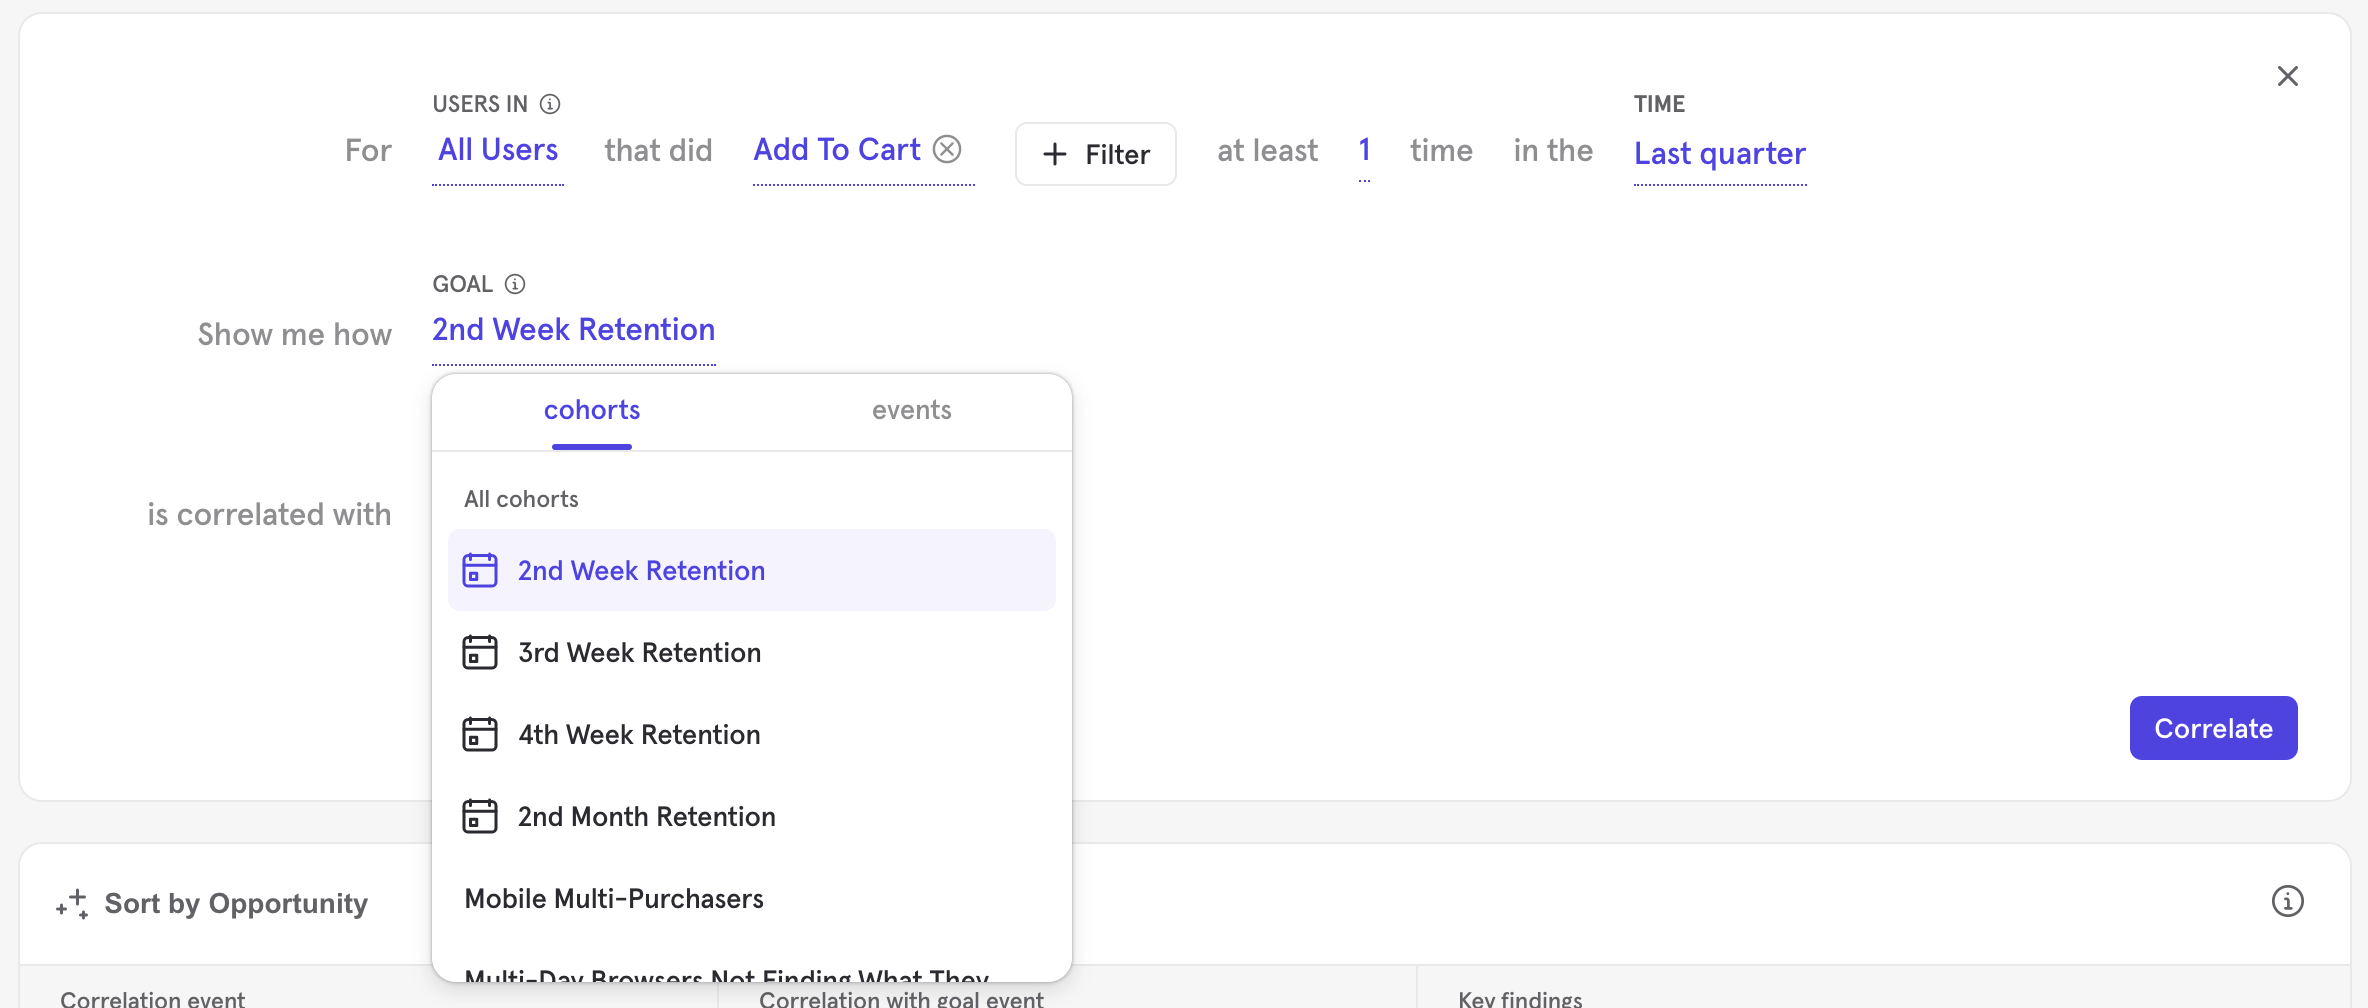
- 2nd week retention: Users doing a specific action or set of actions in your project and then returning to do anything within two weeks.
- 3rd week retention: Users doing a specific action or set of actions in your project and then returning to do anything within three weeks.
- 4th week retention: Users doing a specific action or set of actions in your project and then returning to do anything within four weeks.
- 2nd month retention: Users doing a specific action or set of actions in your project and then returning to do anything within two months.
- Determine and select the Correlation Event and its properties. It is possible to add up to ten different correlation events by clicking the + button at the bottom of the query builder.
- The correlation event can be broken down by property. To do this, select + Breakdown and select the property to break the data down by.
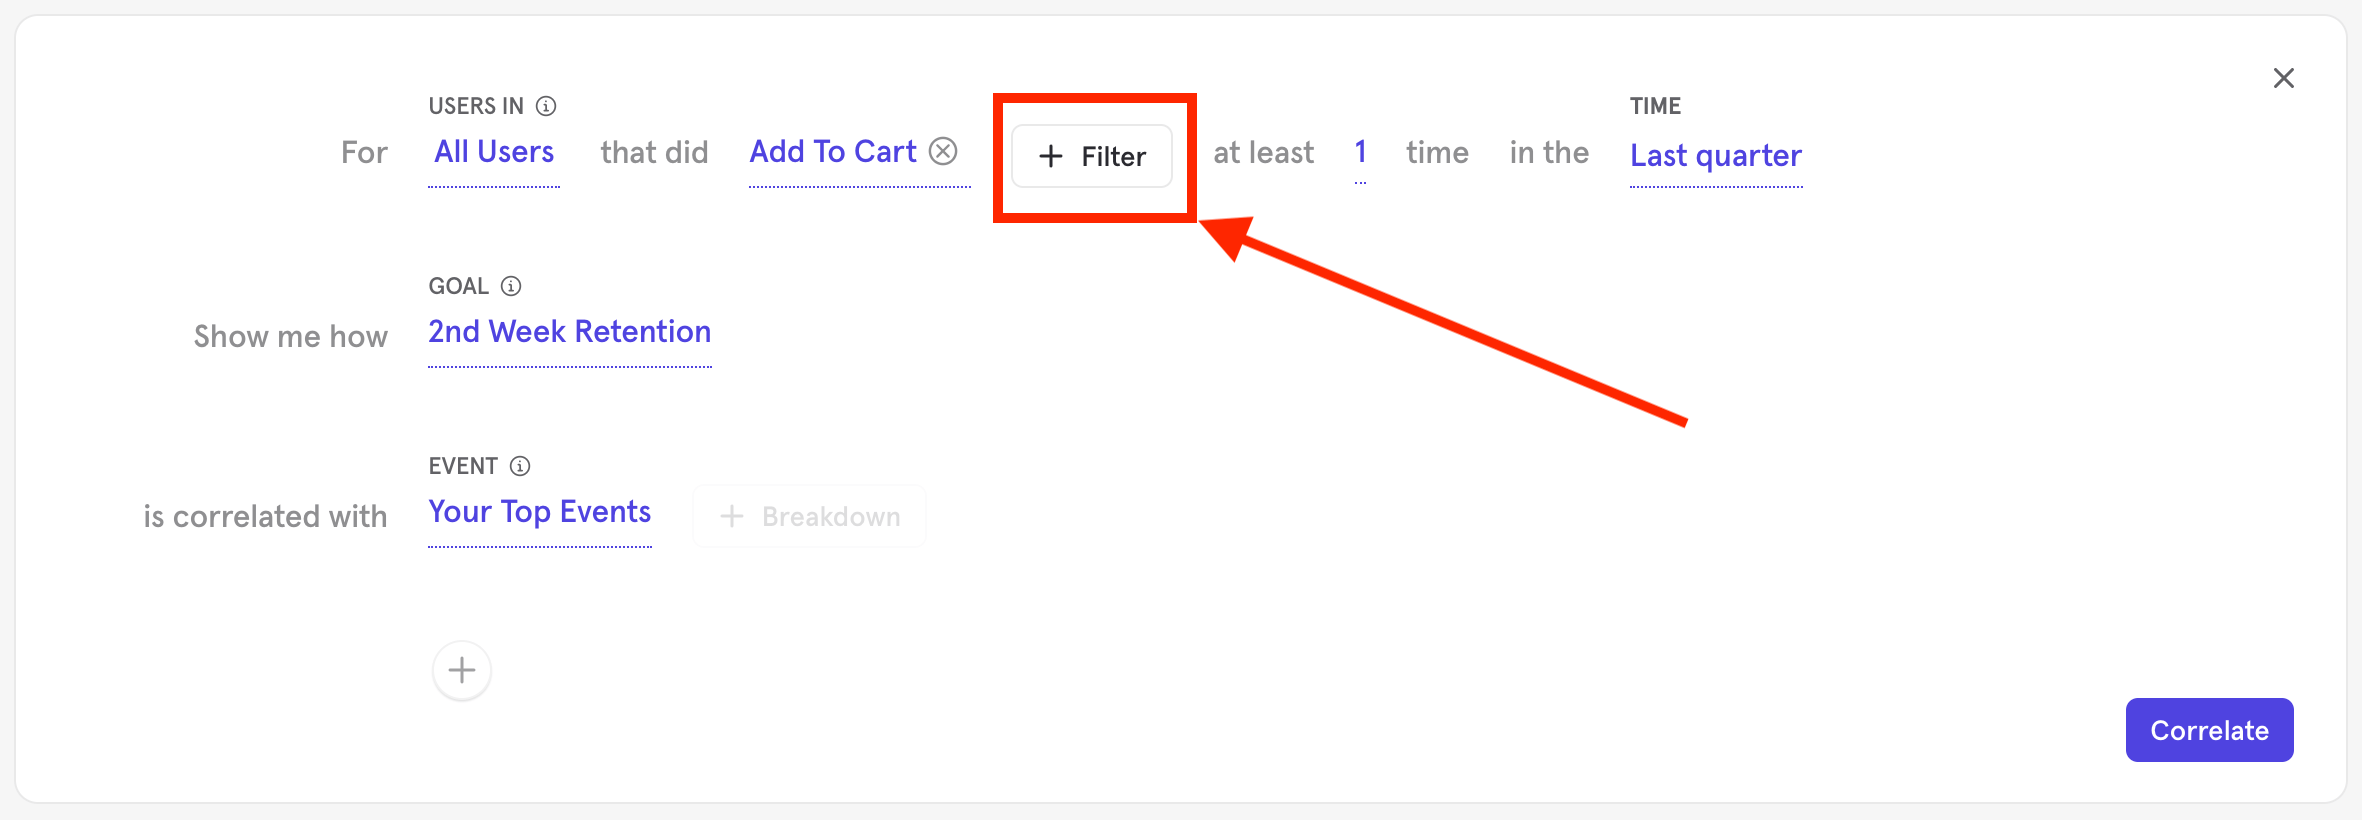
- The correlation event can be filtered by property. To do this, select + Filter and select the property and property value you want to filter by.
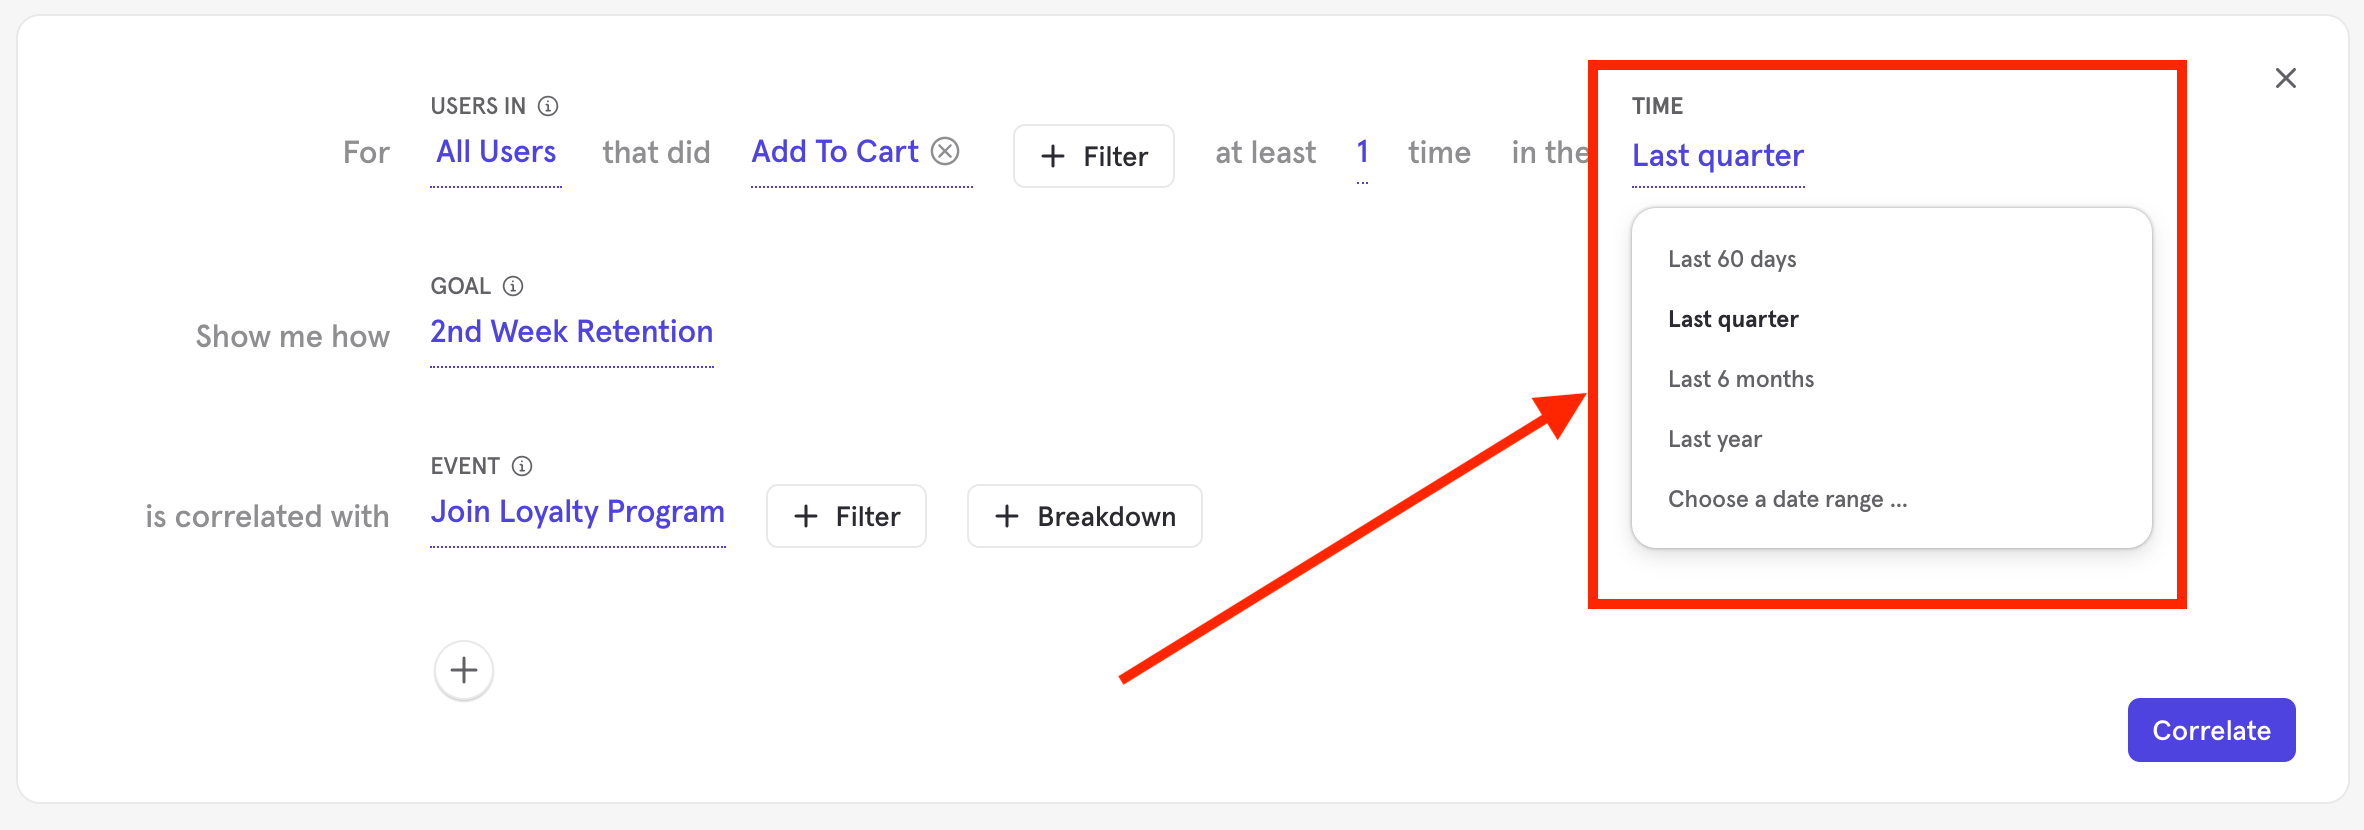
- Select the time frame for the query and the users who are to be evaluated. It’s important to select a long enough time frame that allows users to complete both the correlation event(s) and the goal event.
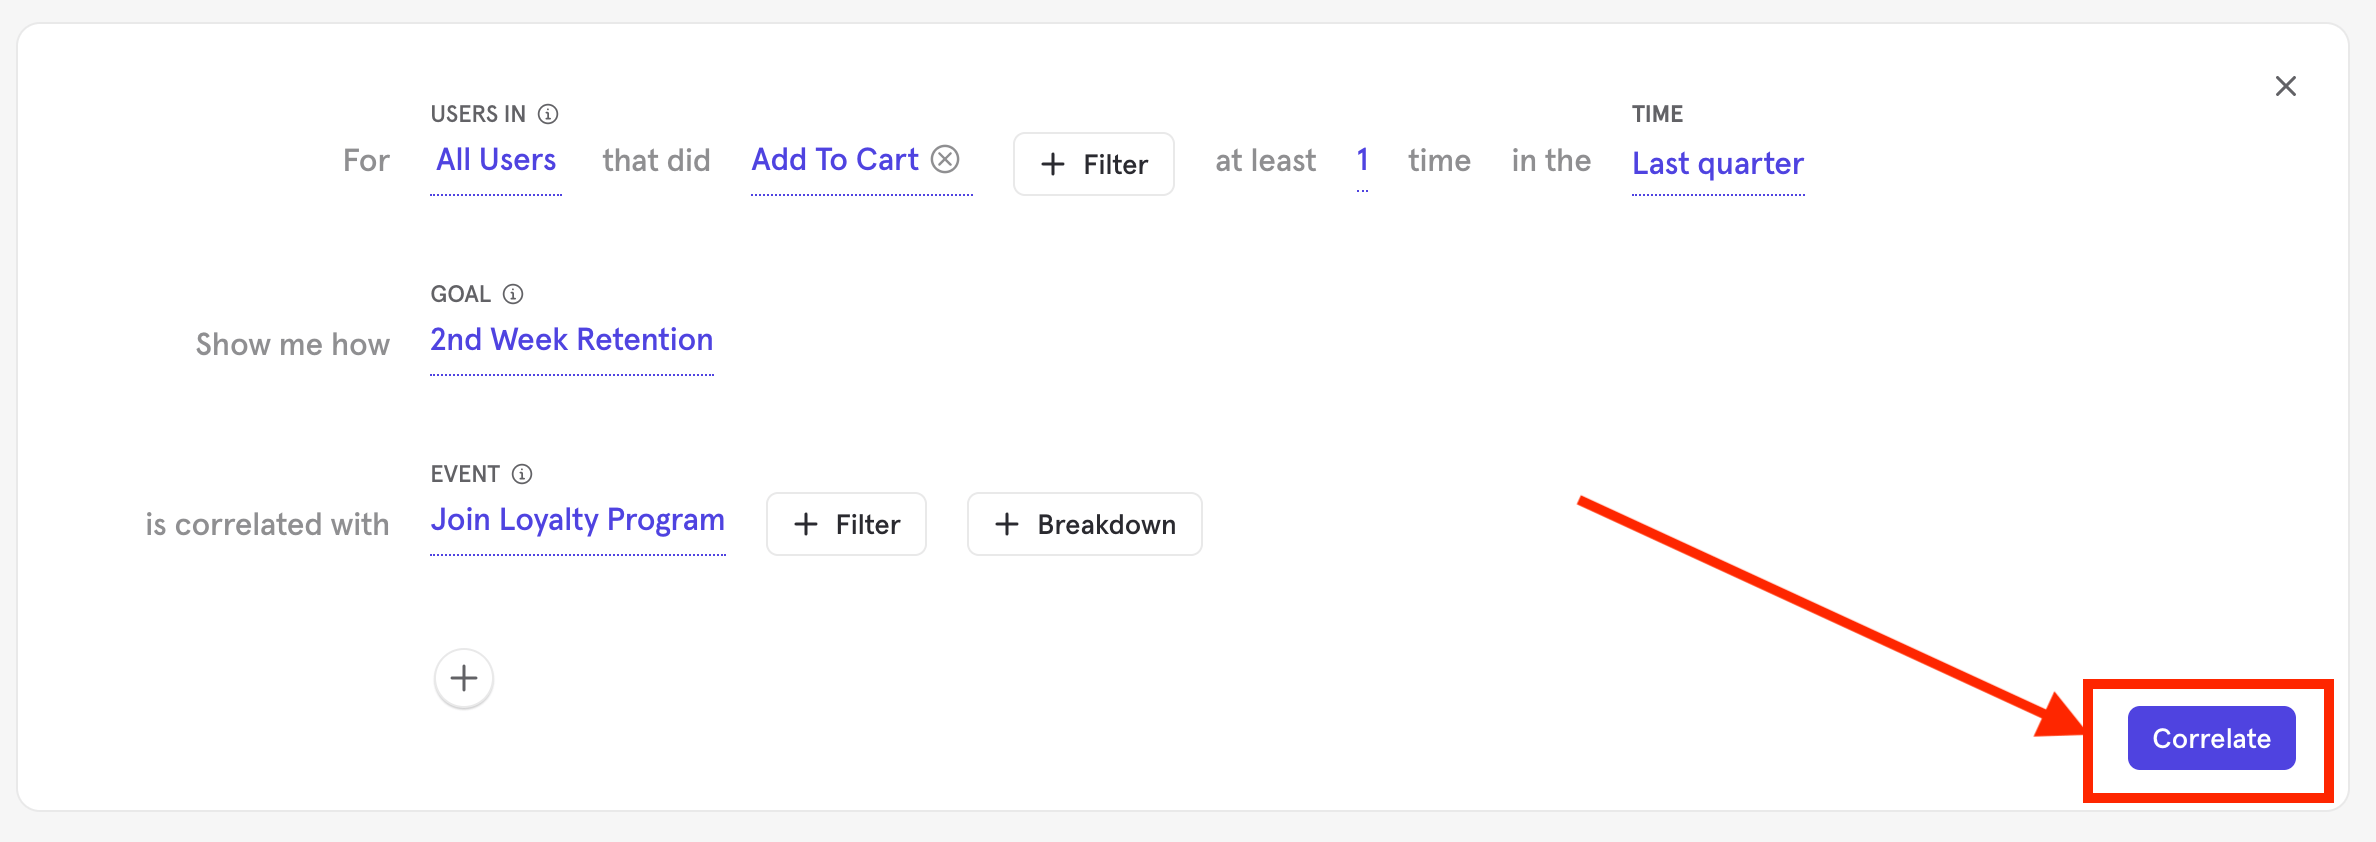
- Click Correlate.
Interpreting Results
Summary View
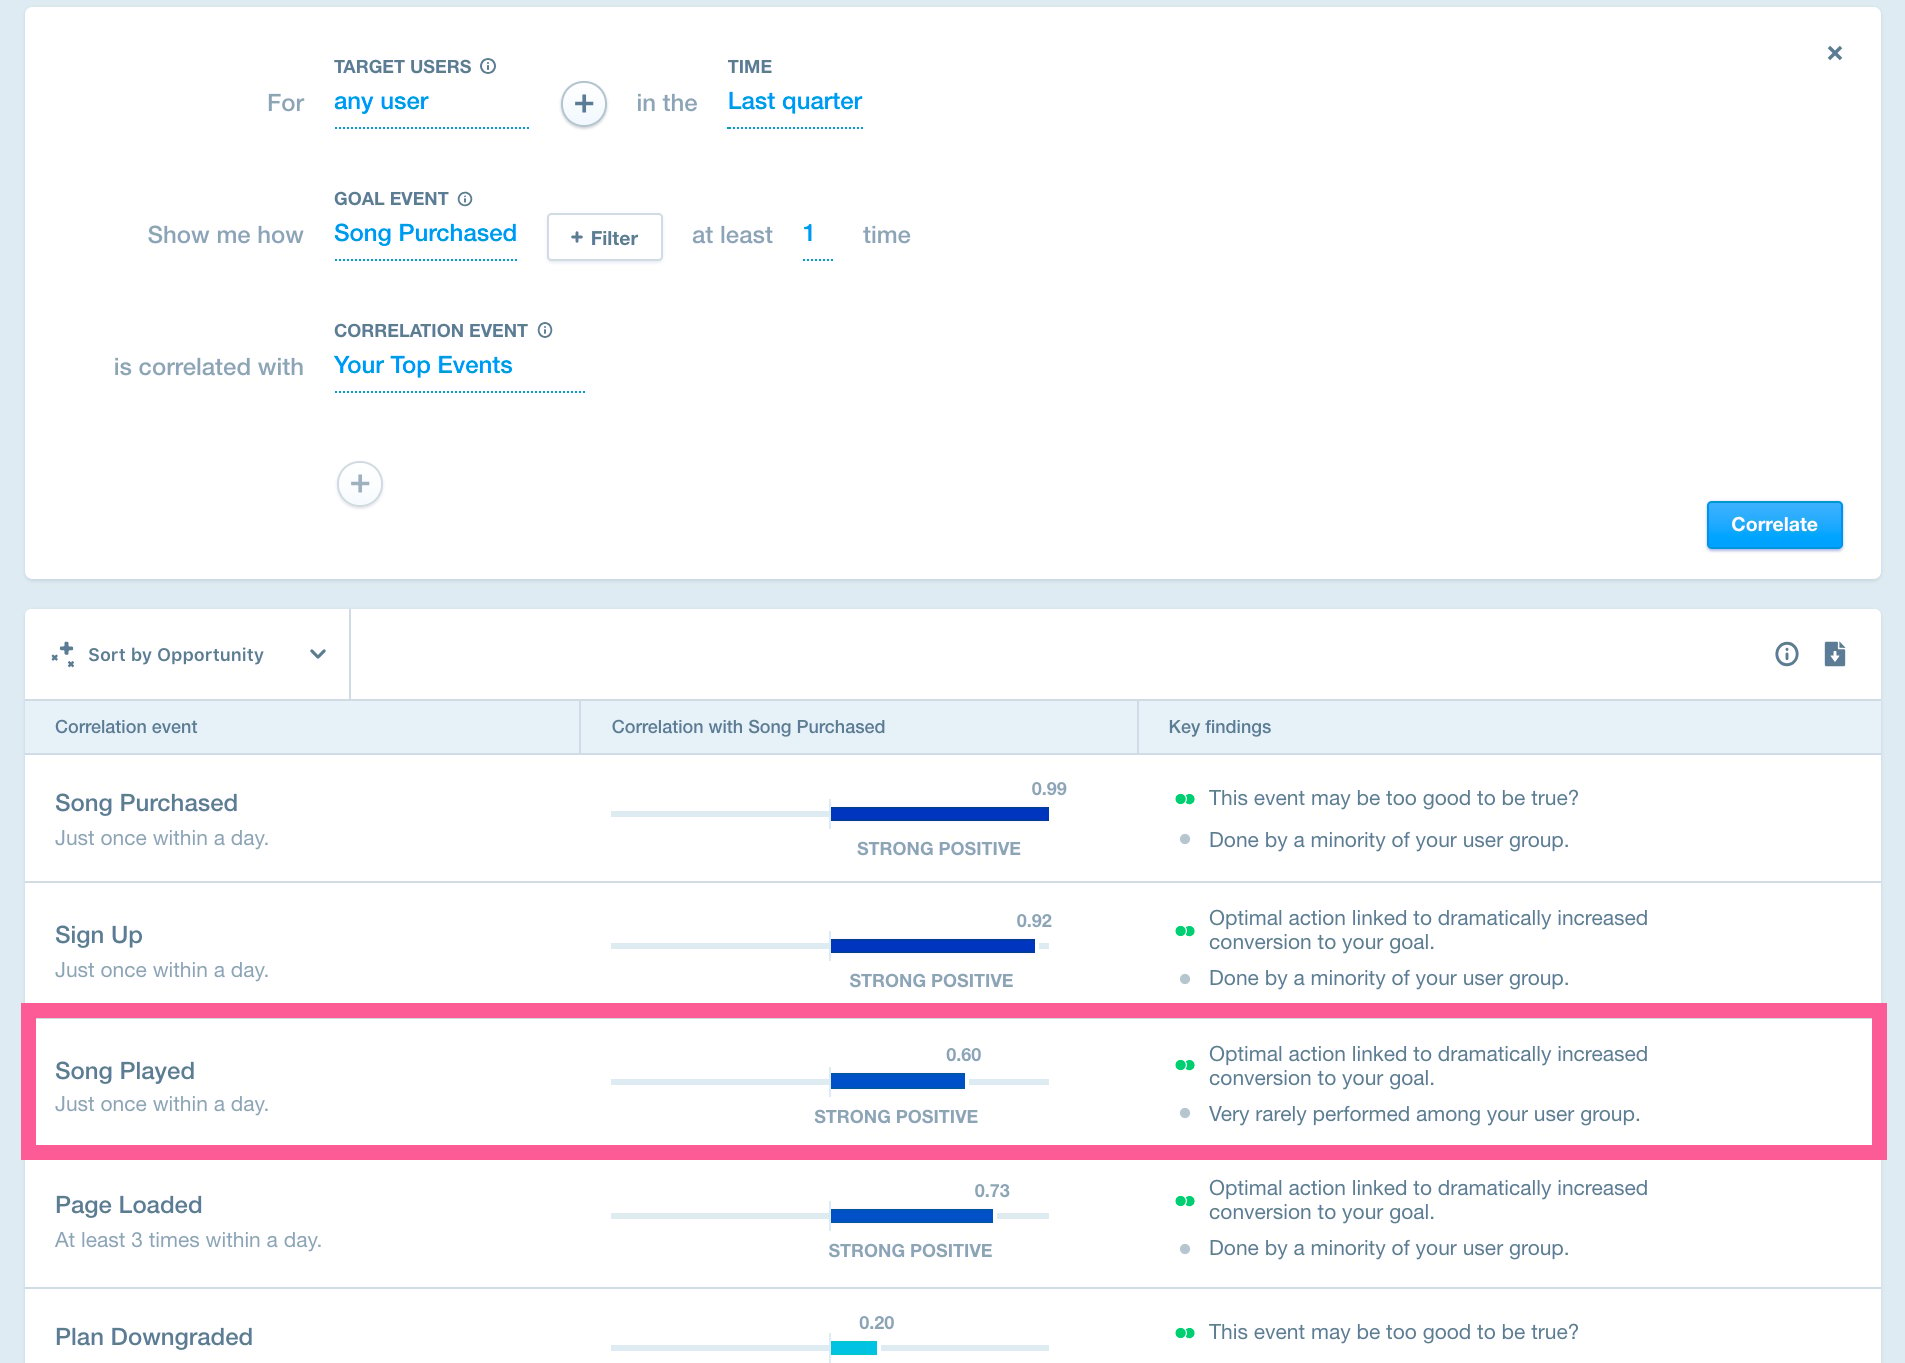
Each correlation will be represented by one card in the summary view results. The list-view will display the optimal action, correlation with the goal event, and key findings about the event. Results can be sorted by correlation strength or by Mixpanel opportunity score.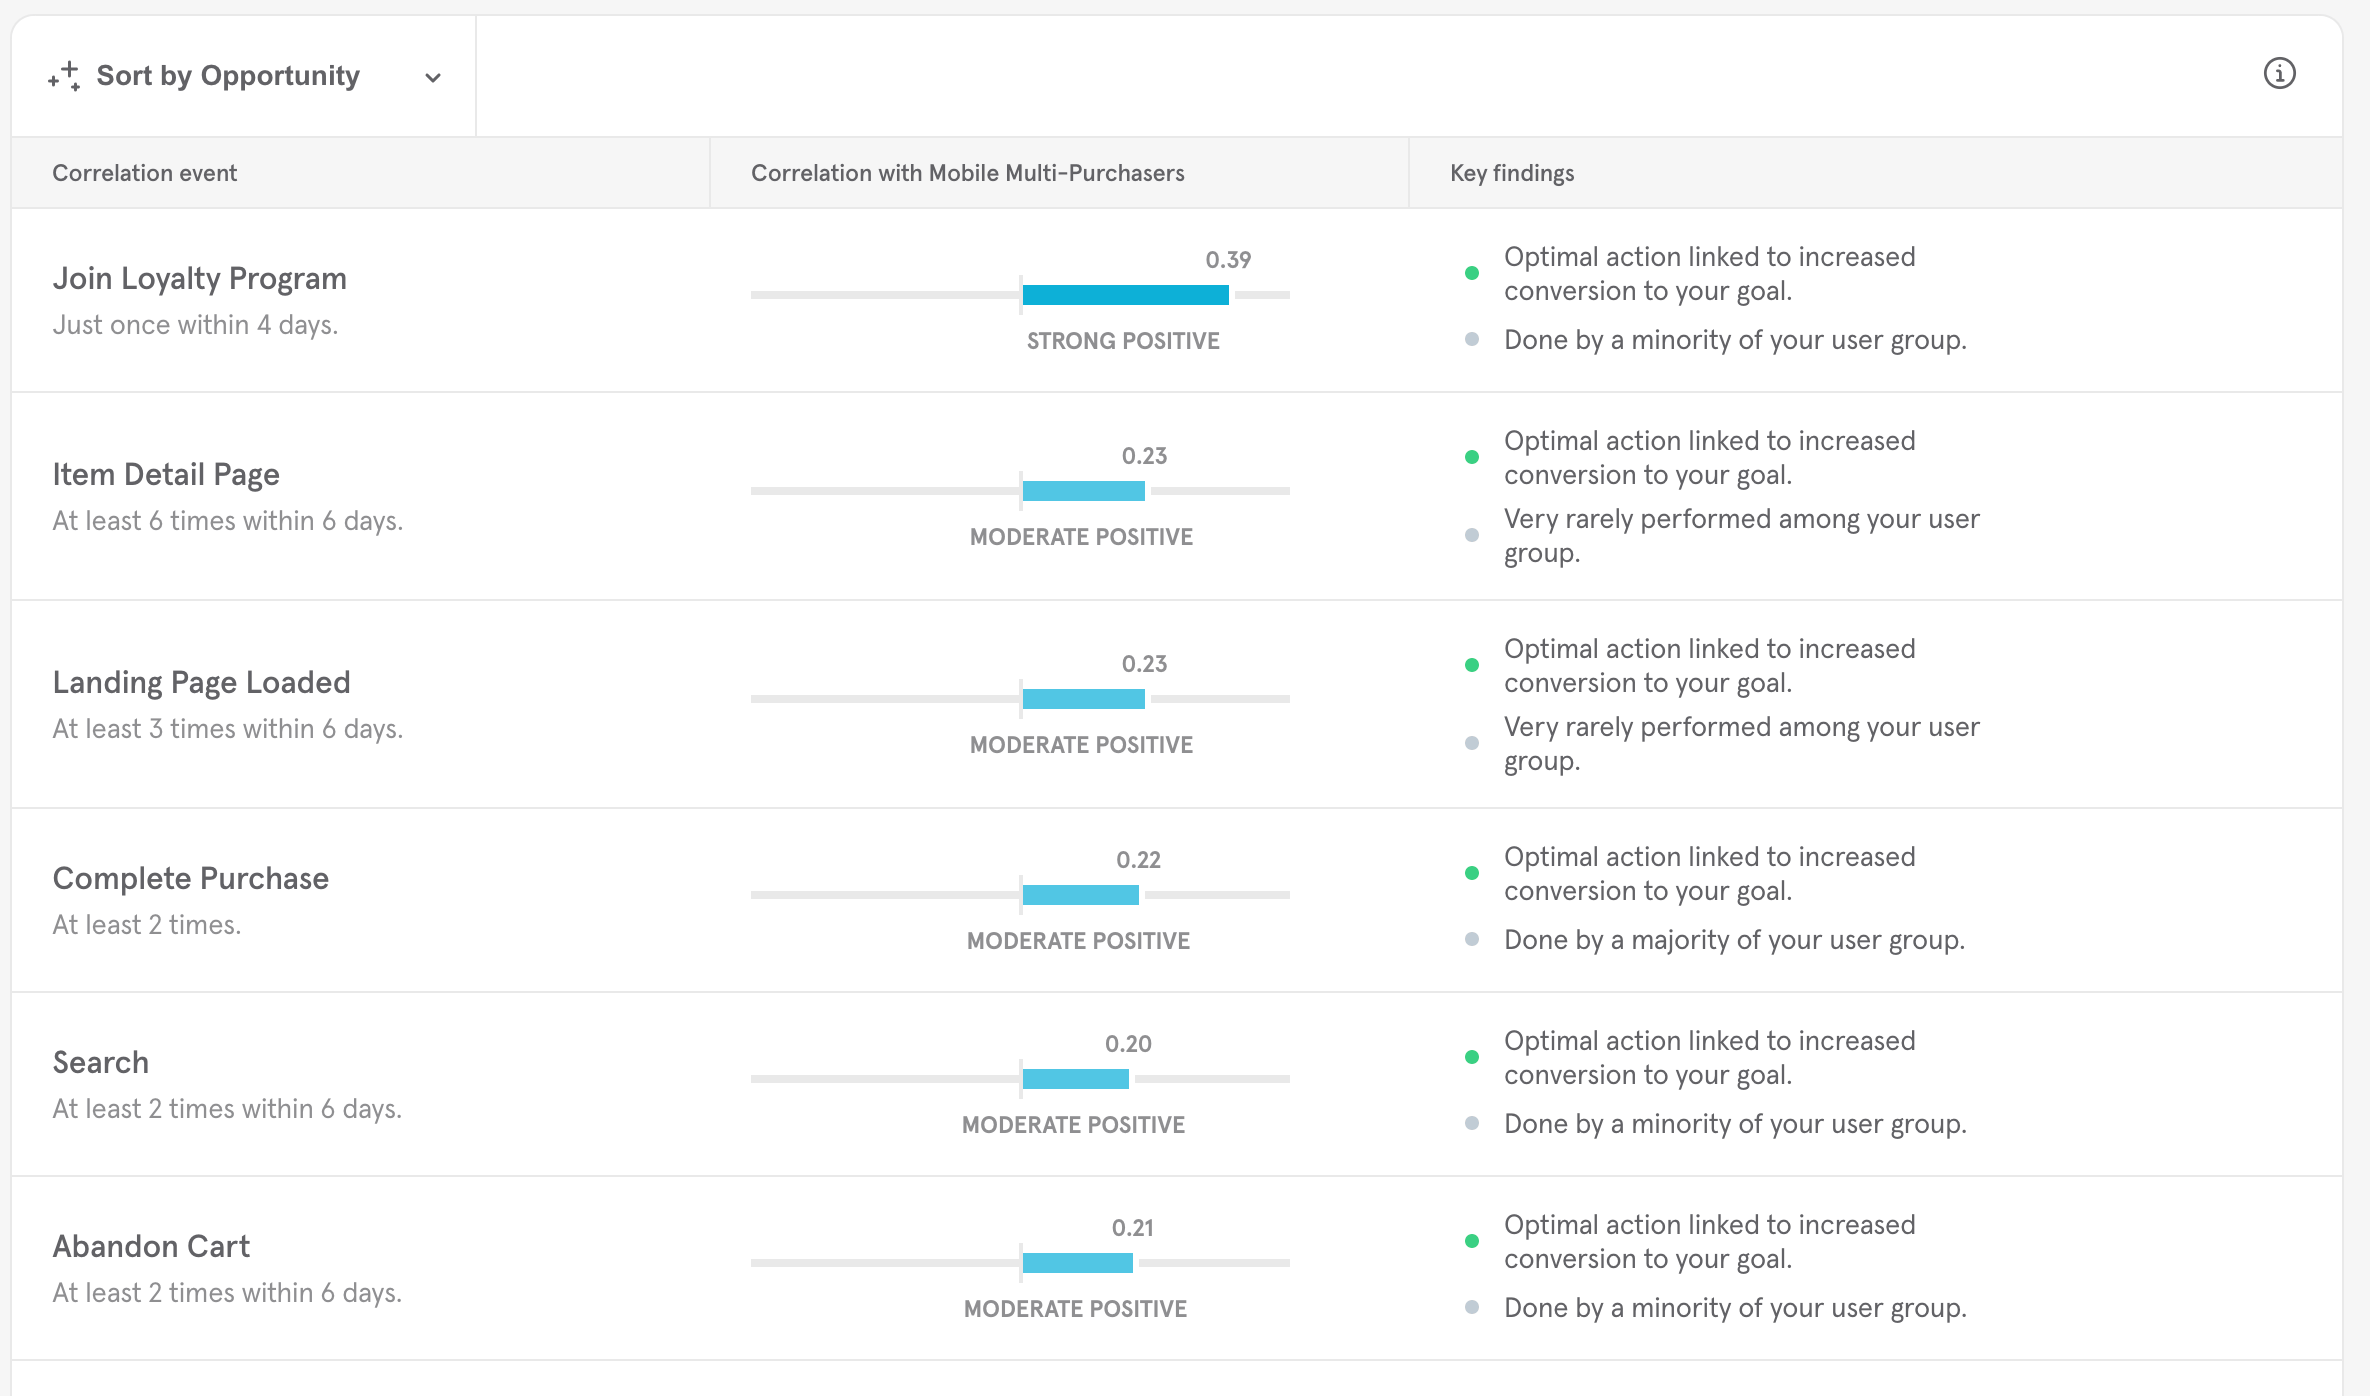
Scores
By default, the results will be sorted by Opportunity. “Opportunity” is Mixpanel’s proprietary calculation of how important a given correlation might be. The correlation strength is calculated using the phi coefficient. Reference here for more detail on how Opportunity and correlation strength is calculated.Key Findings
The key findings presented are rarity analysis results and conversion measurements. Rarity defines how common or uncommon it is for users to complete an individual event. The conversion measurements qualifies how likely a given conversion is to be helpful. Rarity Analysis can be broken down into:- Rare in user group.
- Never performed in user group.
- Uncommon in user group.
- Common in user group.
- Majority of user group performed.
- No users converted to goal.
- Unlikely to be useful.
- Associated almost perfectly with not converting.
- Associated almost perfectly with converting.
Detailed view
To access the detailed view, click on a card in the summary view.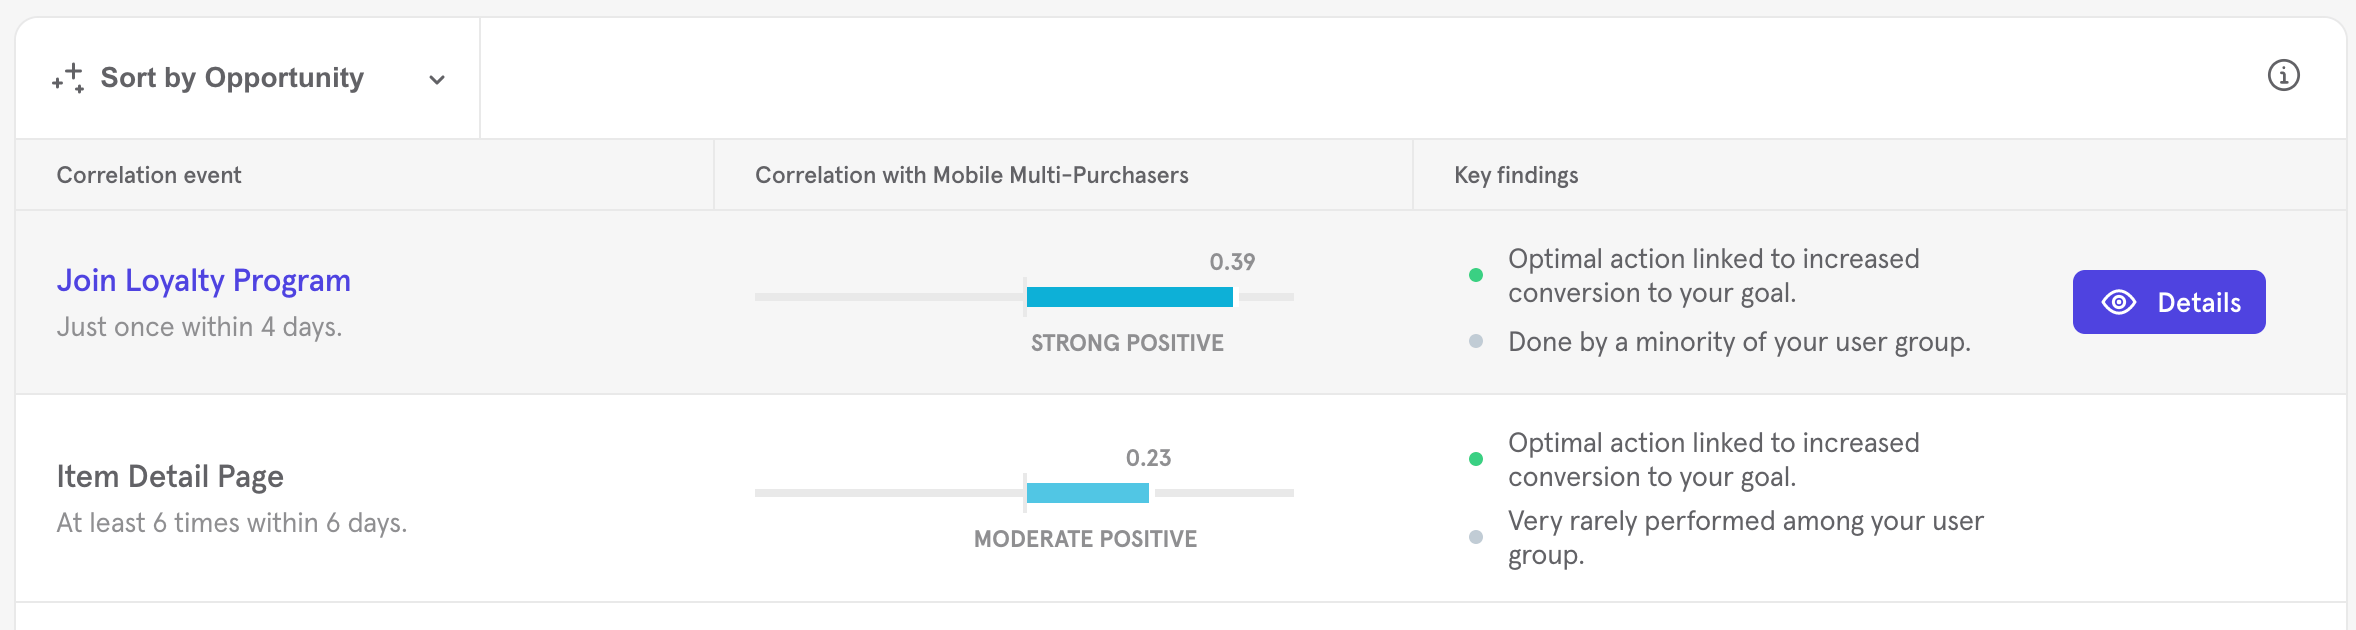
Optimal Action
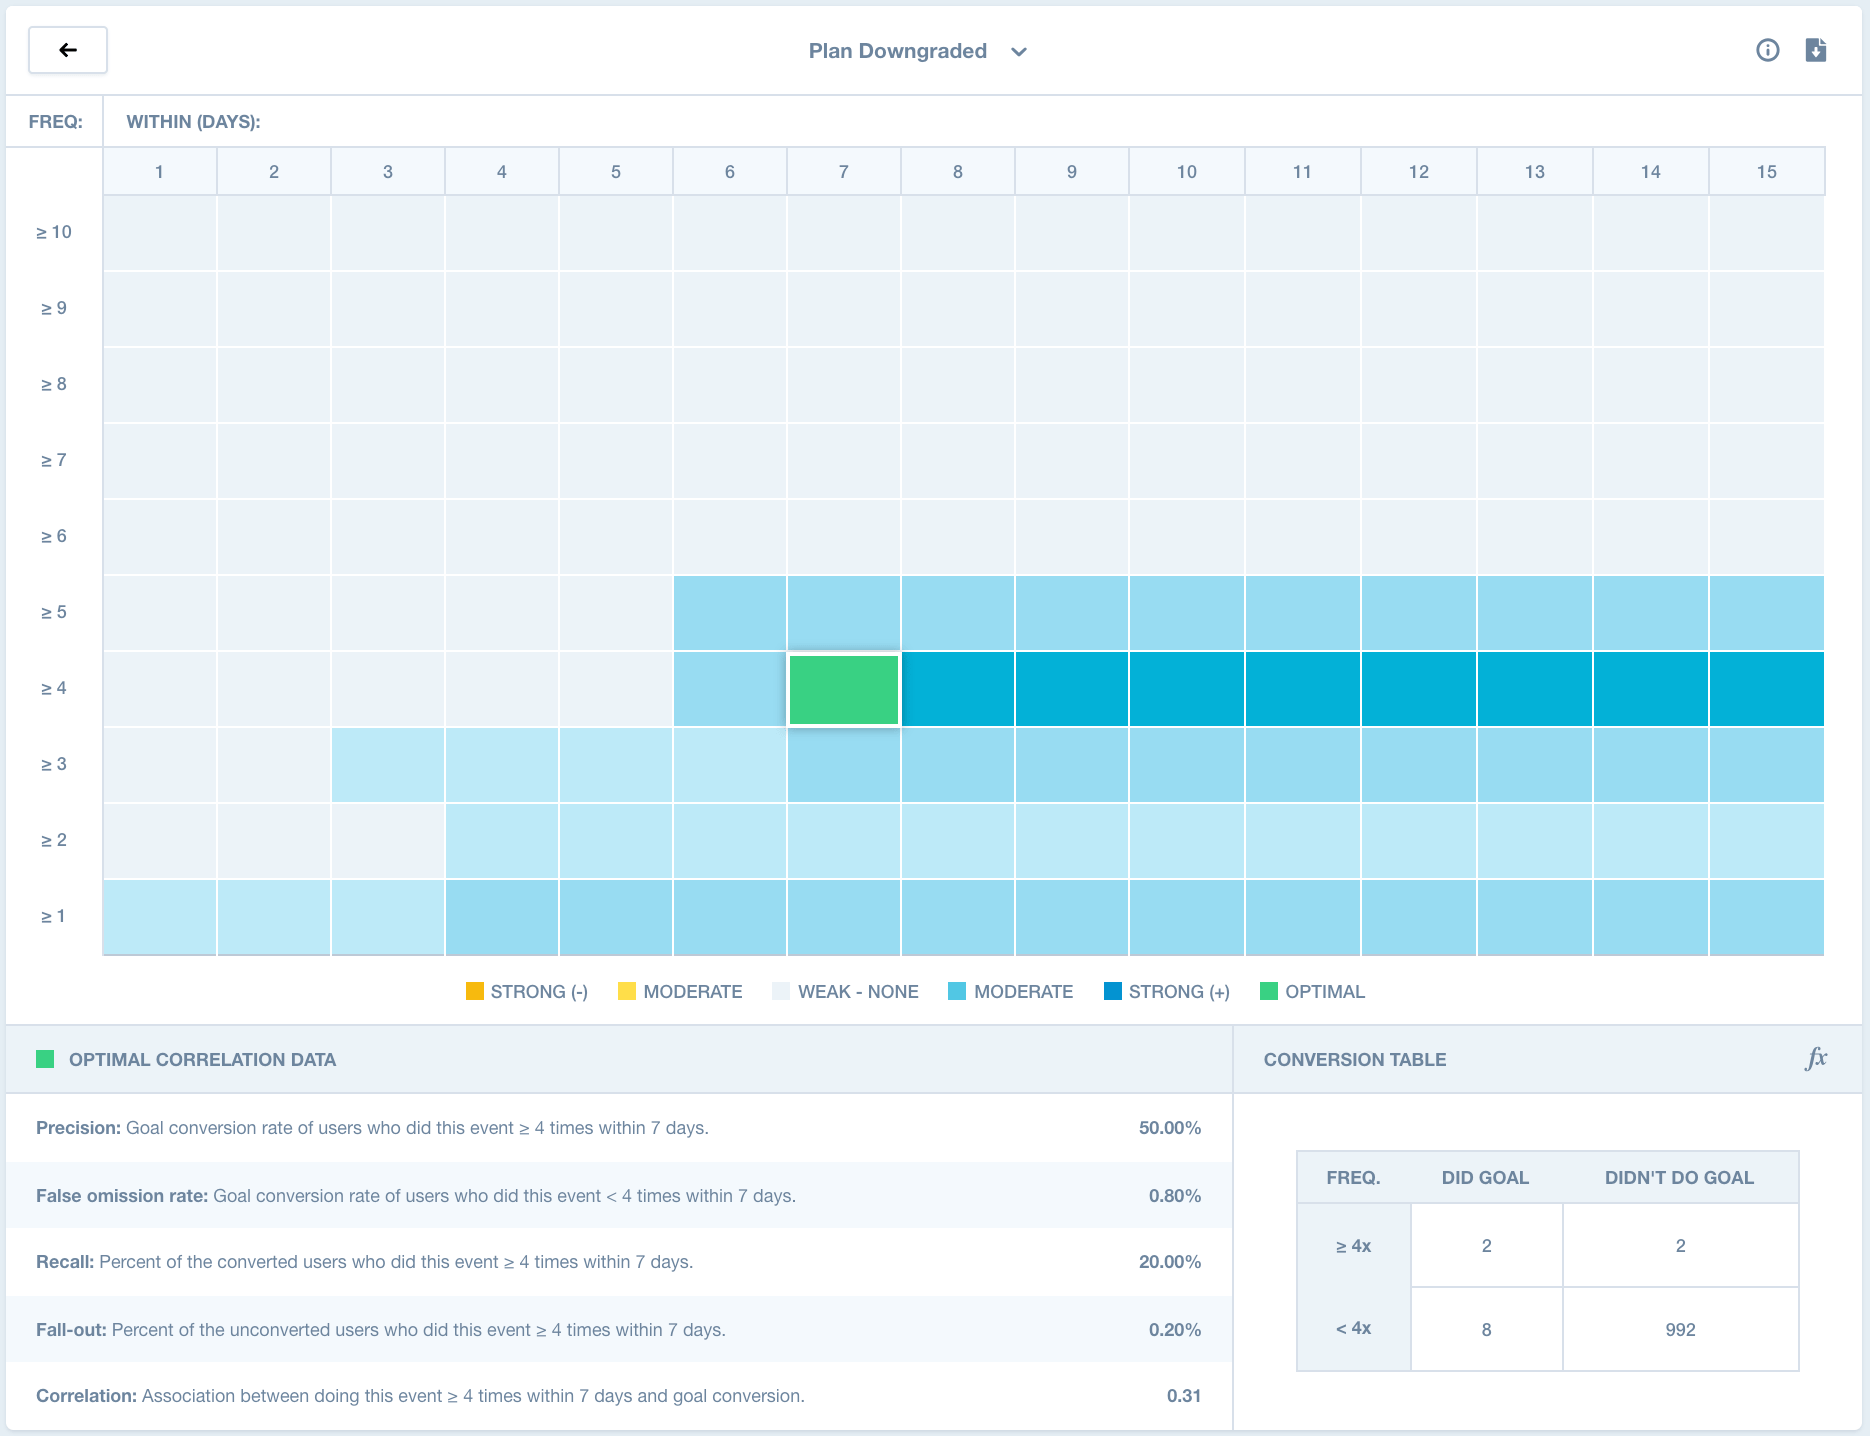
The optimal action will be highlighted in green on the heat map. The optimal action tells you how many times and in how many days your customers should do the event in order to achieve your optimal correlation. Frequency labels are listed below the action and provide precise information, based on the correlation, about when your users should complete the event. For example, if you are a music streaming app and wanted to see how a “Play Song” event correlates with two week retention, you might see something like, “Play song once within ten days” as an optimal action.Supporting Statistics
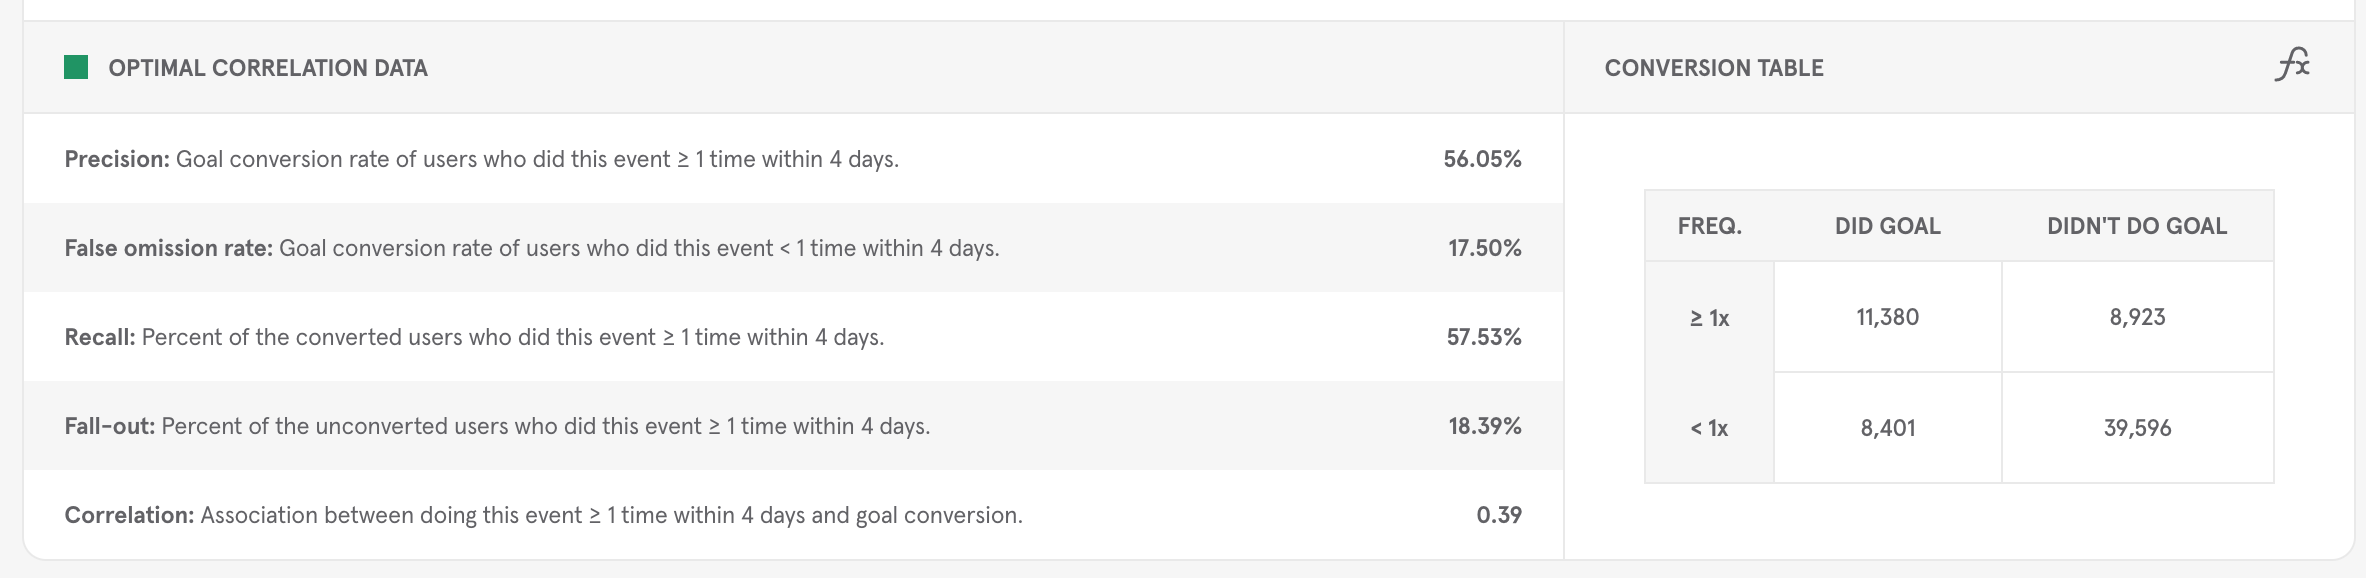
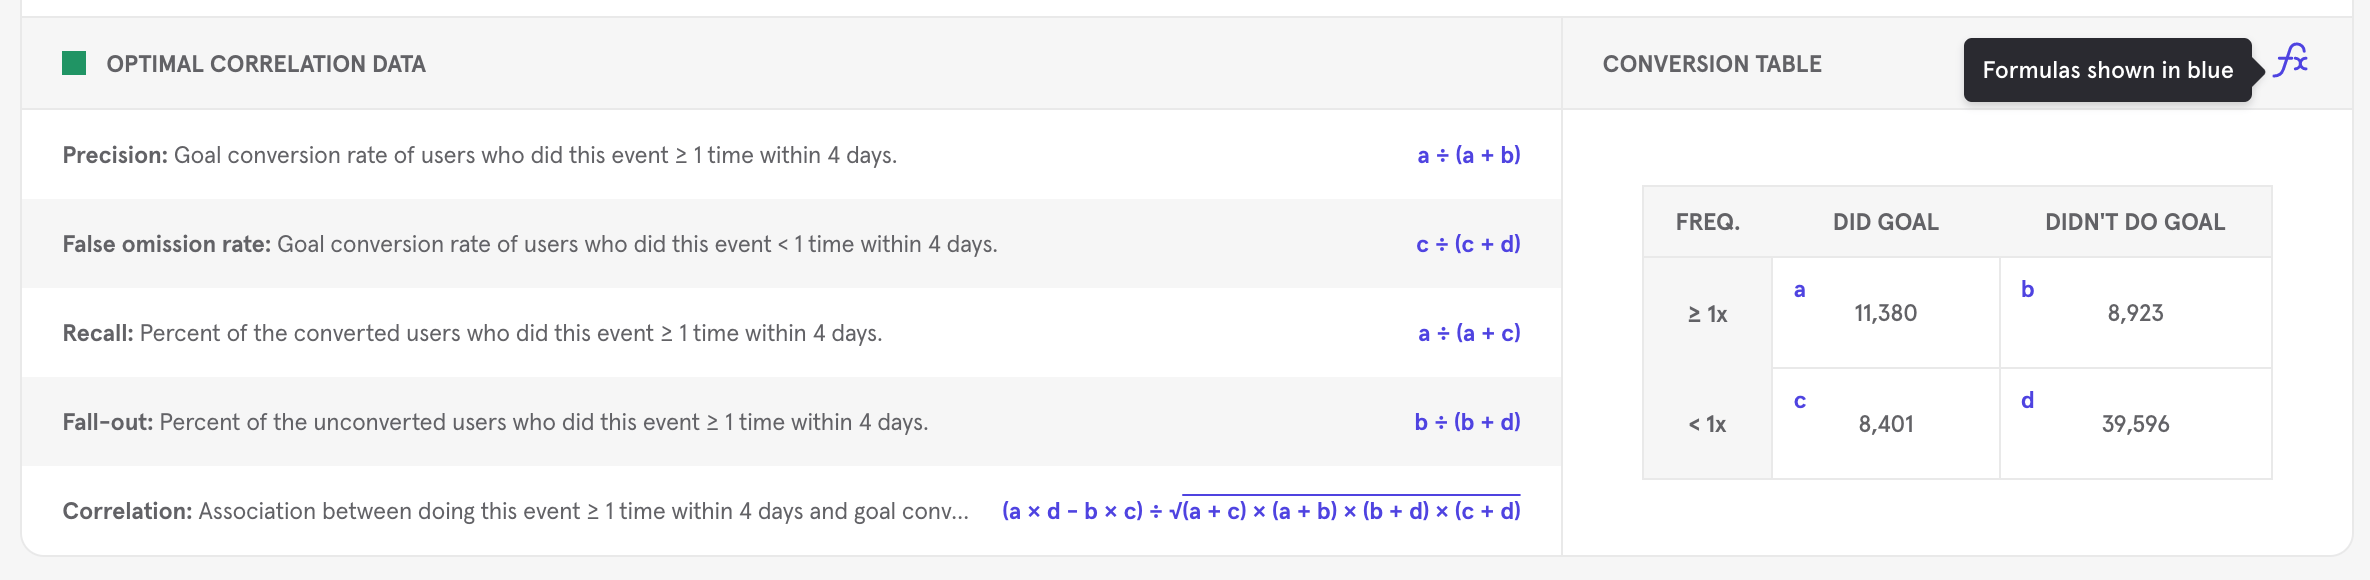
For each combination Mixpanel will provide supporting statistics for further analysis:- Precision: Percent of users who convert to your goal among those who did this event at least x times within y days.
- False omission rate: Percent of users who convert to your goal among those who did this event fewer than x times within y days.
- Recall: Percent of converted users who did this event at least x times within y days.
- Fall-out: Percent of unconverted users who did this event at least x times within y days.
- Correlation: Association between performing this event at least x times in y days and converting to your goal.
Key Findings
Signal also presents two key findings, rarity analysis results and conversion measurements. Rarity defines how common or uncommon it is for users to complete an individual event. The conversion measurements qualifies how likely a given conversion is to be helpful. For example, if all users are converting because the application forces this by design, then the conversion measurement will flag this as “unlikely to be useful”.CSV Download
To download the results to a CSV, click the Download CSV icon in the upper right hand corner of the Summary Results view or the Detailed Results view after you have run your correlation.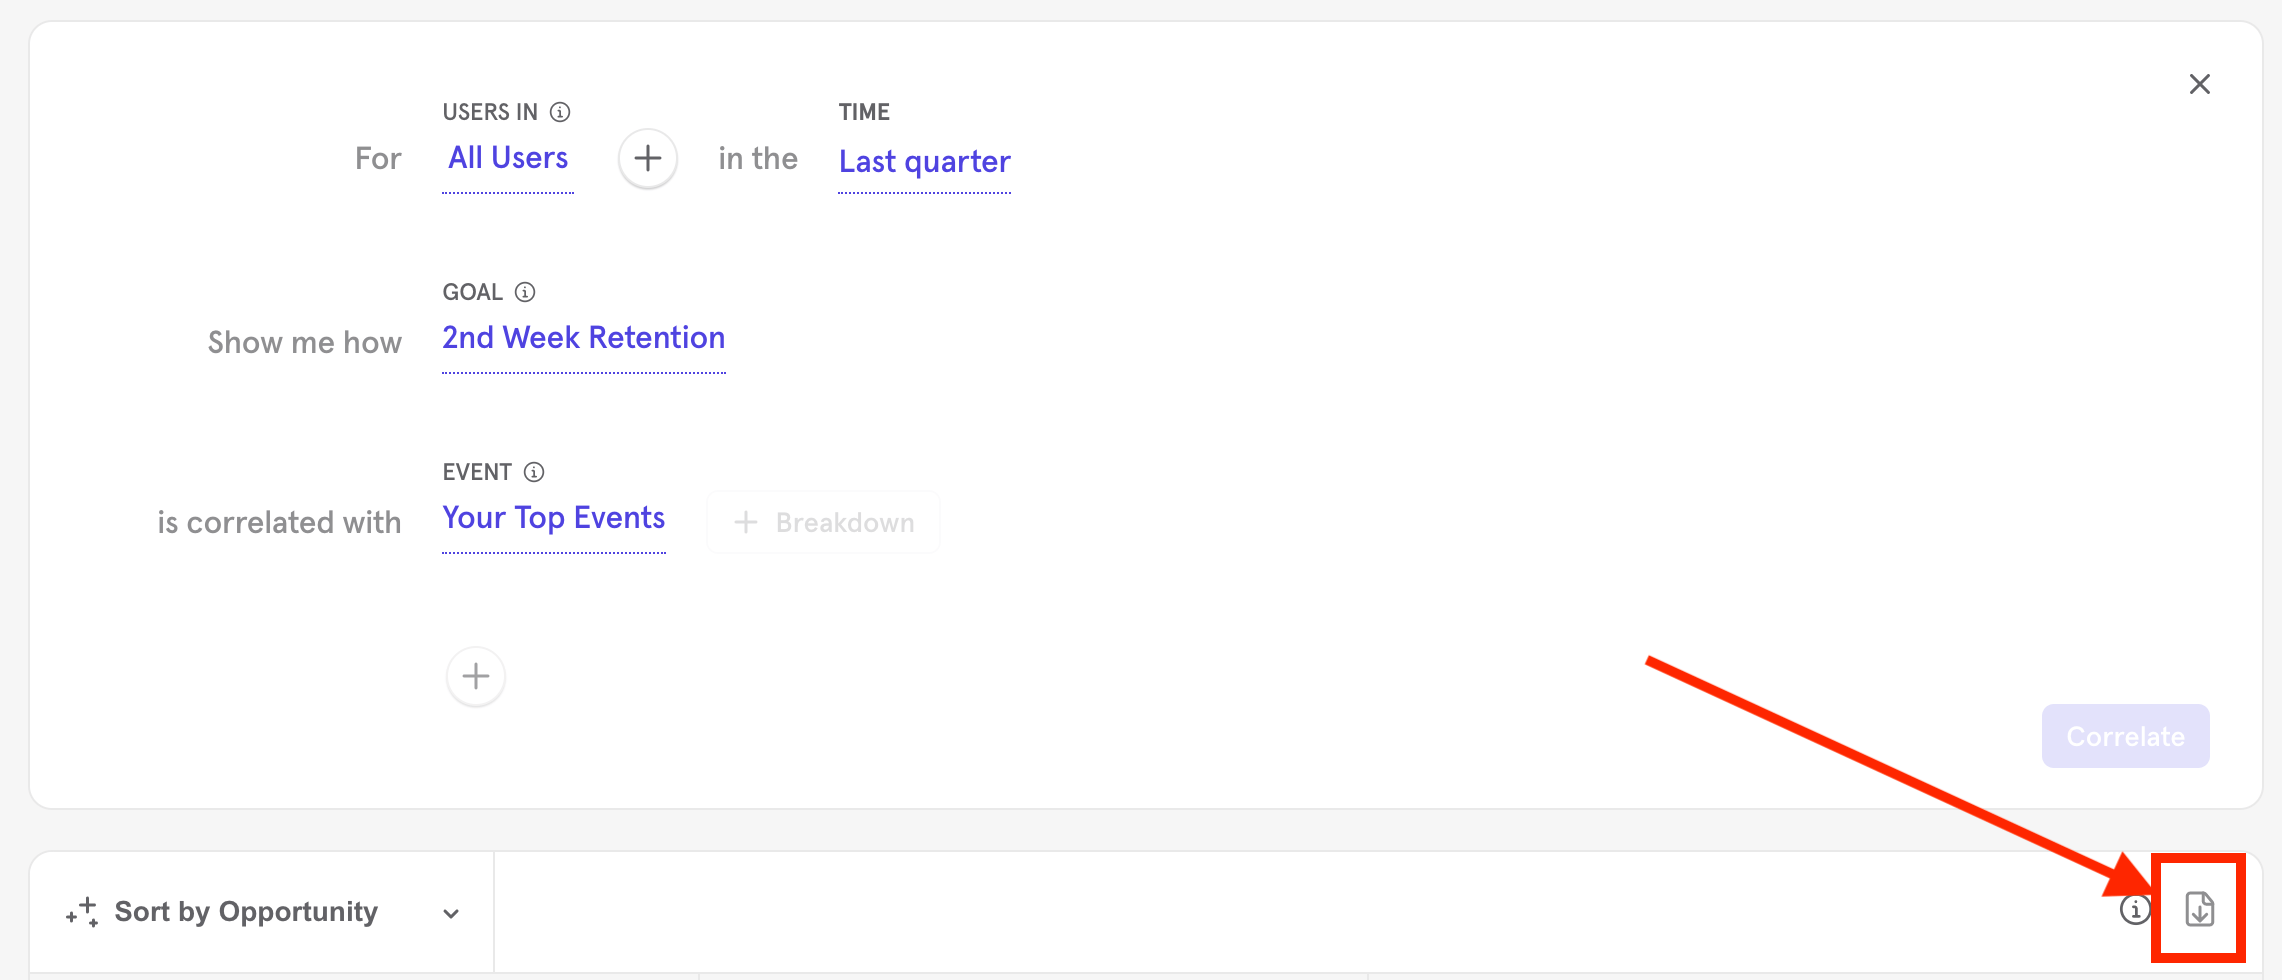
Reference
New Users vs All Users
New users are users who have completed their first event in the selected time frame. All users will look at all users in your Mixpanel project who have completed the event in the selected time frame.Download Glossary
- Frequency: Number of times, up to 10, a user should complete the event for the correlation.
- Intervals: Number of days, up to 15, when a user should complete the event for the correlation.
- True positive: Number of positive correlations that are correctly identified.
- True negative: Number of negative correlations that are correctly identified.
- False positive: Number of positive correlations that are incorrectly identified.
- False negative: Number of negative correlations that are incorrectly identified.
- Correlation: The association between your event to your goal event.
- Precision: Percent of users who convert to your goal among those who did this event at least x times within y days
- Fall-out: Percent of unconverted users who did this event at least x times within y days.
- Recall: Percent of converted users who did this event at least x times within y days.
- False Omission Rate: Percent of users who convert to your goal among those who did this event fewer than x times within y days.
- Phi max: Single number between -1 and 1 that indicates how closely an event moves with your goal event. 1 means that 100% of all users that did your goal event also did the event you are evaluating. -1 means the opposite: 0% of users that did you goal event also did the event you are evaluating.
- Mixpanel Opportunity Score: Mixpanel’s proprietary calculation of how important a given correlation might be.
Calculations
Signal calculates correlation using a well-known statistical algorithm called the phi coefficient. In addition to correlation, Mixpanel calculates what is called an opportunity score, and also presents a list of key findings.Correlation
The phi coefficient is a single number between -1 and 1 and it indicates how closely an event moves with your goal event. 1 means that 100% of all users that did the goal event also did the correlation event. -1 means that 0% of users that did the goal event also did the correlation event.Opportunity Score
“Opportunity” is Mixpanel’s proprietary calculation of how important a given correlation might be. Opportunity helps pare down results by eliminating false positives and highlighting weak correlations that may be actionable. Based on this assessment, which determines how much an event impacts conversion on your goal, Mixpanel will tell you if there is an opening to make a change in your product or not. Once we have the correlation, the results on the summary page will display the optimal action, correlation with the goal event, and our key findings about that optimal action. The optimal action tells you how many times and in how many days your customers should do the event in order to achieve your optimal correlation. Frequency labels are listed below the action and provide precise information, based on the correlation, about when your users should complete the event. For example, if you are a music streaming app and wanted to see how a “Play Song” event correlates with two week retention, you might see something like, “Play song once within ten days” as an optimal action. Frequency Labels — *these will be supplemented with temporal labels, i.e. At least 4 times in 10 days.*- Many times
- Just once
- At least x times
- Always avoid
- As few times as possible
- No strong correlations found
- Is complex
- Rare in user group
- Never performed in user group
- Uncommon in user group
- Common in user group
- Majority of user group performed
- Example: None of the users analyzed converted to the goal in question.
- Example: There may be no correlation (positive or negative) between the two events.
- Example: Users who trigger an “uninstall” event are not going to complete your Goal event.
- Example: Users who trigger a purchase event will always trigger an add to cart event. Add to cart and purchase will always have high correlation.