Overview
Annotations add valuable context to your reports by linking notes to specific dates. Use them to highlight events such as product launches, marketing campaigns, or data anomalies, so viewers can clearly understand what influenced the metrics. You can view Annotations directly on time-series charts and in the Annotations side panel across all reports.Adding Annotations
1
Open the Annotations side panel to create an annotation
Select the Annotations tab (above the query builder) and click the “+” button to add a new annotation.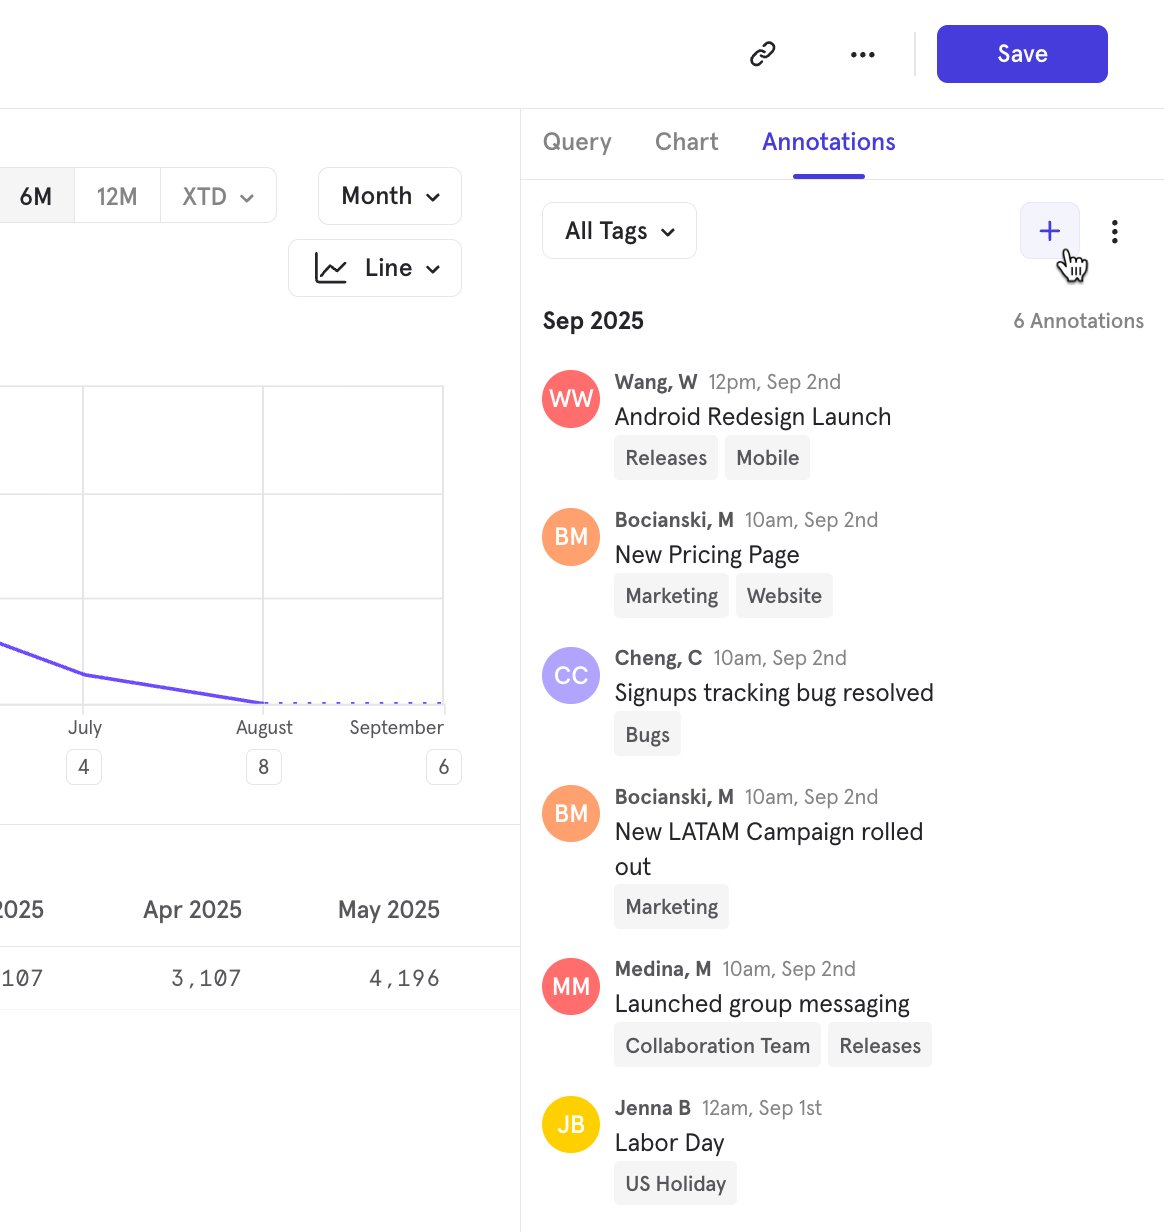
2
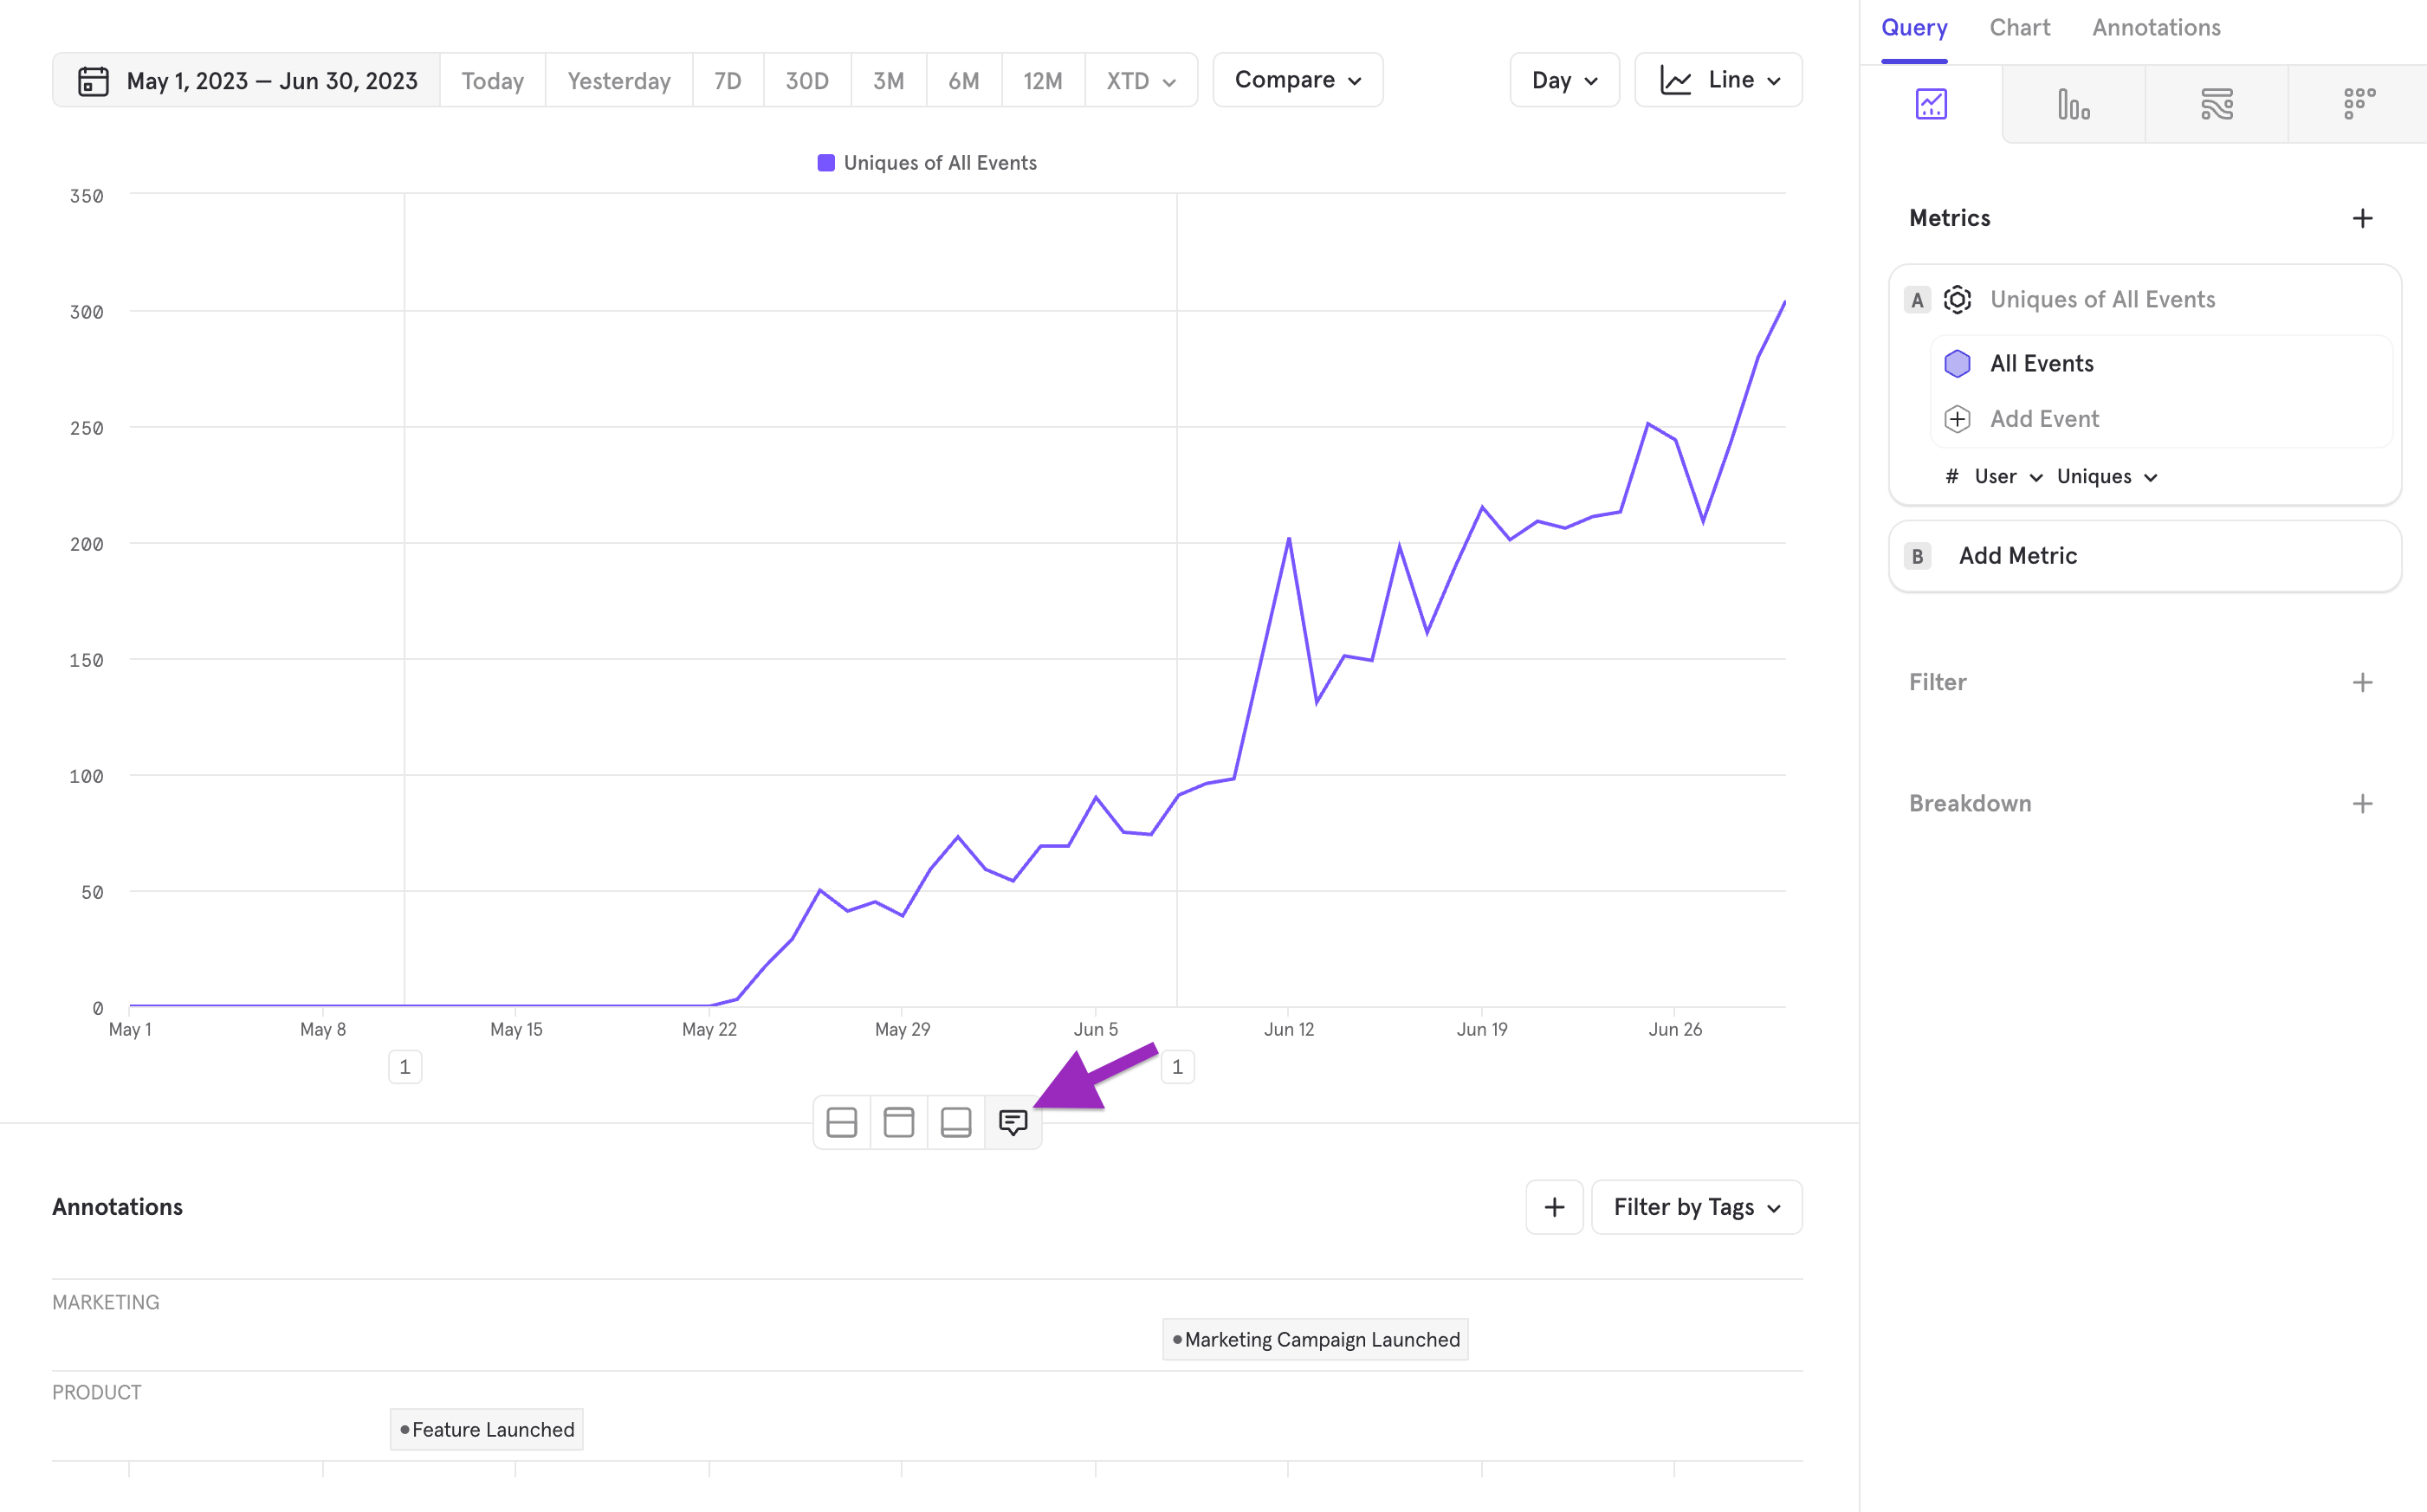
Alternatively, you can create annotations from the bottom of a time-series Insights report
Charts with time intervals (such as line, stacked line, column, and stacked column charts) are time-series charts and support Annotations.Hover over the horizontal axis to locate the time interval, then click the “+” button to create an annotation for that point in time.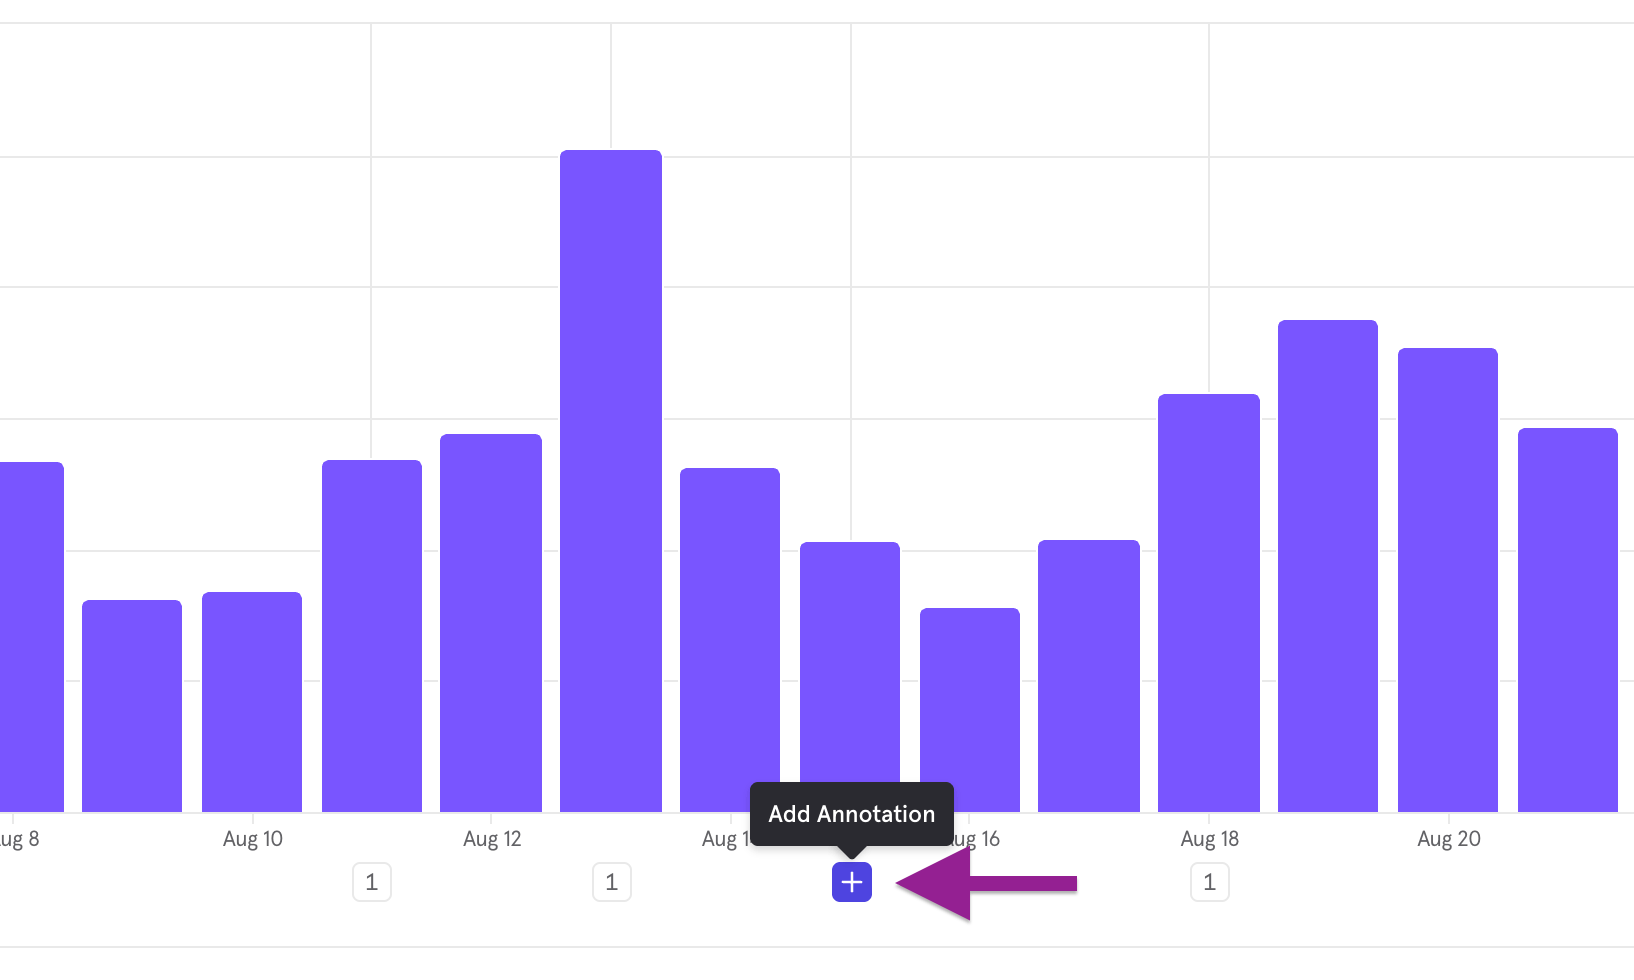
3
Select a date and time, then enter a description
Add one or more tags to categorize the annotation.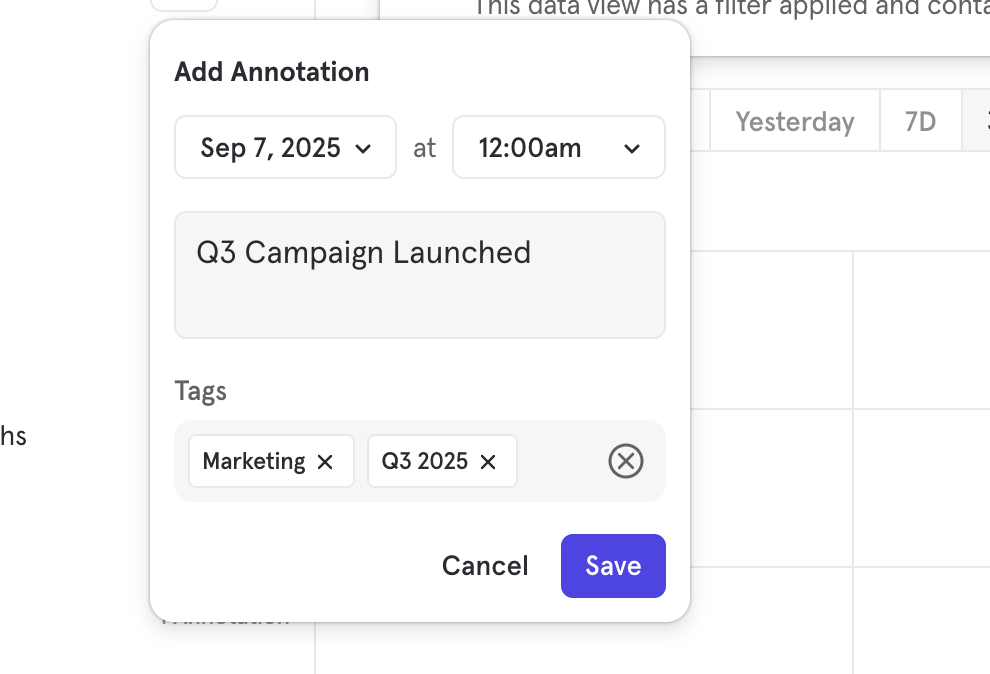
Use tags consistently (e.g., Launches, Outages, Holidays, and even Team names) so it is easy to filter and spot patterns.
Viewing Annotations
Annotations appear as markers directly on the chart. Hover over a marker to view its details. For example, in the chart below, you can see 1 annotation in March, 4 in May, and 2 in July.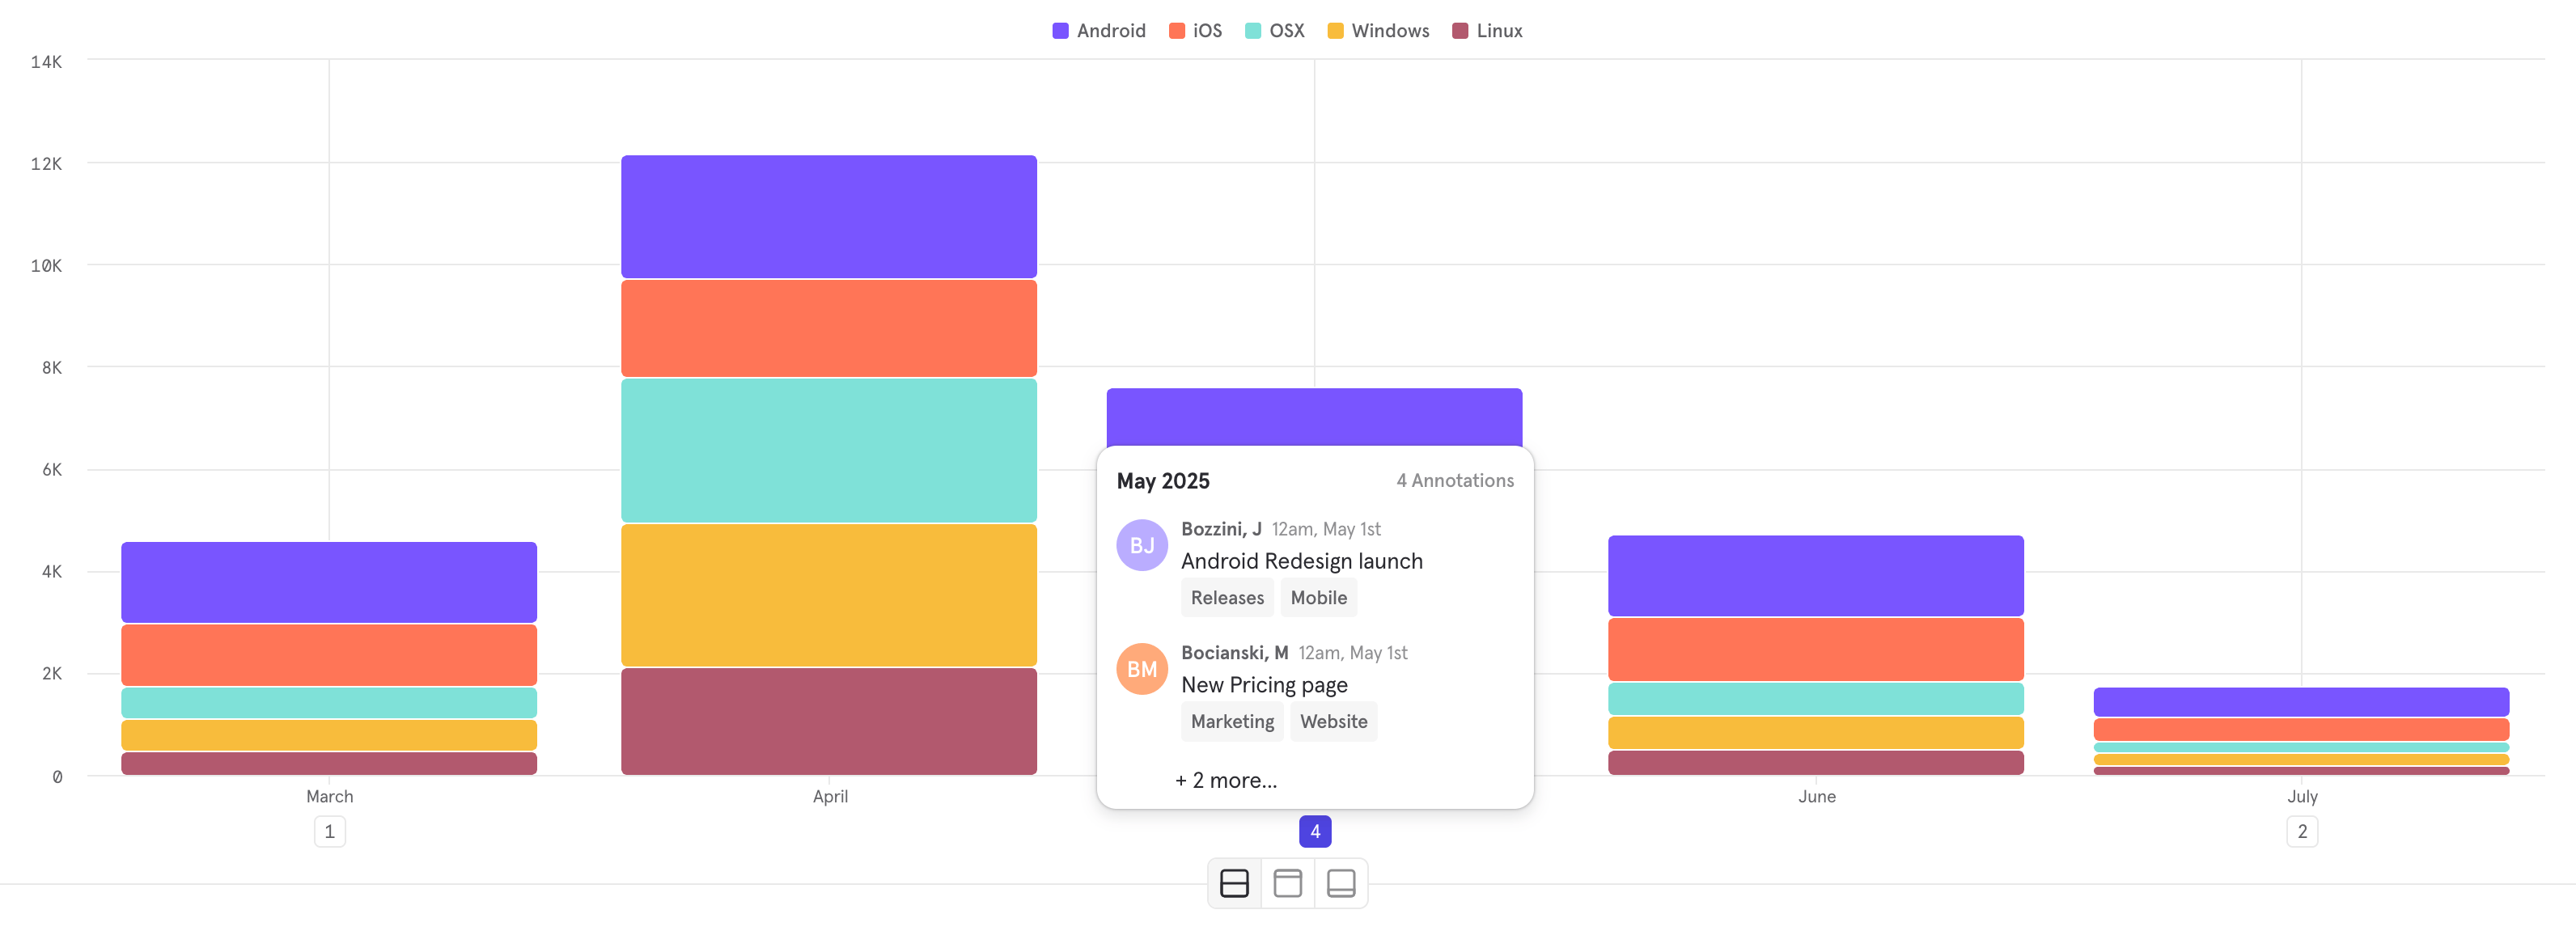
Annotations Side-panel
Open the Annotations side panel (available in all reports) to view all annotations for your report’s date range in one place. Select the Annotations tab (above the query builder) to open the side-panel. From the side panel, you can:- Browse all annotations within your report’s date range.
- Hide/Show annotations
- Sort by date
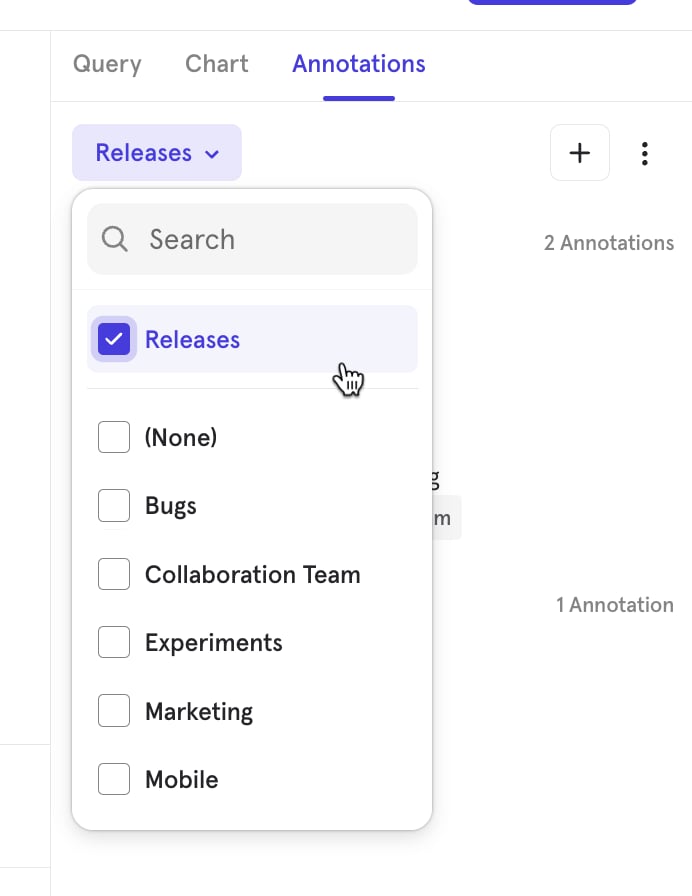
- Filter Annotations by tags
Annotations Timeline
Open the Annotations Timeline (available in time-series Insights reports) to view all annotations for your report’s date range in one place. Once you are on a time-series Insights report (such as a line chart), select the charts and annotations view option to open the Annotations Timeline. From the timeline, you can:- View annotations in a timeline format relative to their position on the time-series chart.
- Browse all annotations within your report’s date range.
- Hide/Show annotations
- Filter Annotations by tags
Editing and Deleting Annotations
Hover over any existing annotations to see available actions. Clicking the “pencil” button allows you to edit the description and add/remove tags - do note that timestamps can’t be edited. Clicking the “trash” button permanently deletes the annotation.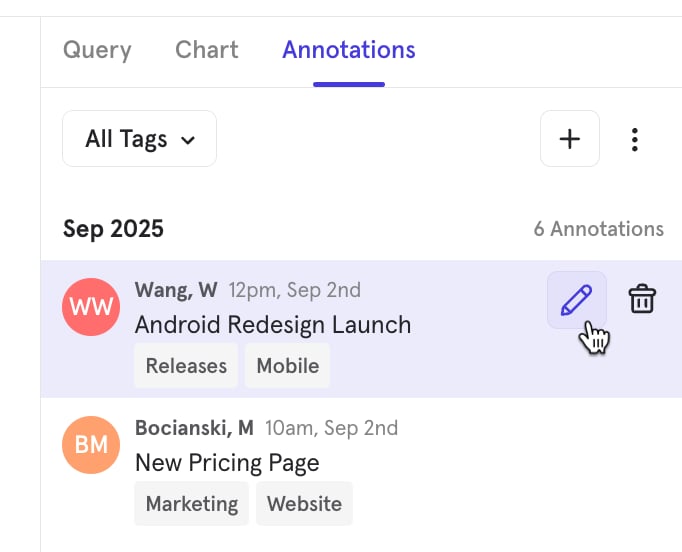
Collaboration and Visibility
- Users with a project role above consumer can create annotations, and each annotation displays the creator’s name.
- Annotations are visible across all reports in the project.
- Use tags and filters to control which annotations appear at the report level.