Overview
Mixpanel’s Revenue Analytics gives product teams comprehensive visibility into how their decisions directly impact business outcomes, connecting product usage with financial performance. It also allows revenue teams to work under one umbrella by breaking down silos and streamlining revenue operations across the customer lifecycle. Revenue Analytics eliminates the traditional barrier between product and financial data by seamlessly integrating with existing data warehouses. Whether your business relies on transaction-based purchases or subscription models, this powerful feature provides a unified view of how product changes translate to revenue results, without complex data engineering or lengthy wait times. Key Benefits- Eliminate data silos between product analytics and revenue data
- Make data-driven decisions without requiring data team involvement
- Track revenue changes over time, including refunds, charge-backs, and subscription changes
- Analyze both one-time purchases and recurring revenue streams
How It Works
Revenue Analytics leverages Mixpanel’s Warehouse Connectors, utilizing two primary data synchronization mechanisms: Mirror and Profile History. Mirror maintains parity between your data warehouse and Mixpanel by regularly polling for changes in the data source and updating the values in Mixpanel. This ensures integrity for purchase-based revenue models by accounting for post-purchase modifications such as refunds, charge-backs, and order cancellations. Profile History utilizes a time-series data structure to track state-based metrics like MRR/ARR at specific points in time. This provides an accurate historical analysis of subscription revenue changes and ties them to user behavior. The system maintains a record of changes to user profiles, which allows for retroactive cohort definitions. You can look at how to build these metrics in Mixpanel by leveraging our SaaS KPIs template on either your data or our public demo data set. There is also a public dashboard to give you a view of the metrics you can build.Common Use Cases
Mixpanel’s Revenue Analytics enables you to analyze your data in powerful ways, regardless of your team, the stage of your company, or your business revenue stream.Transaction-based Business Models
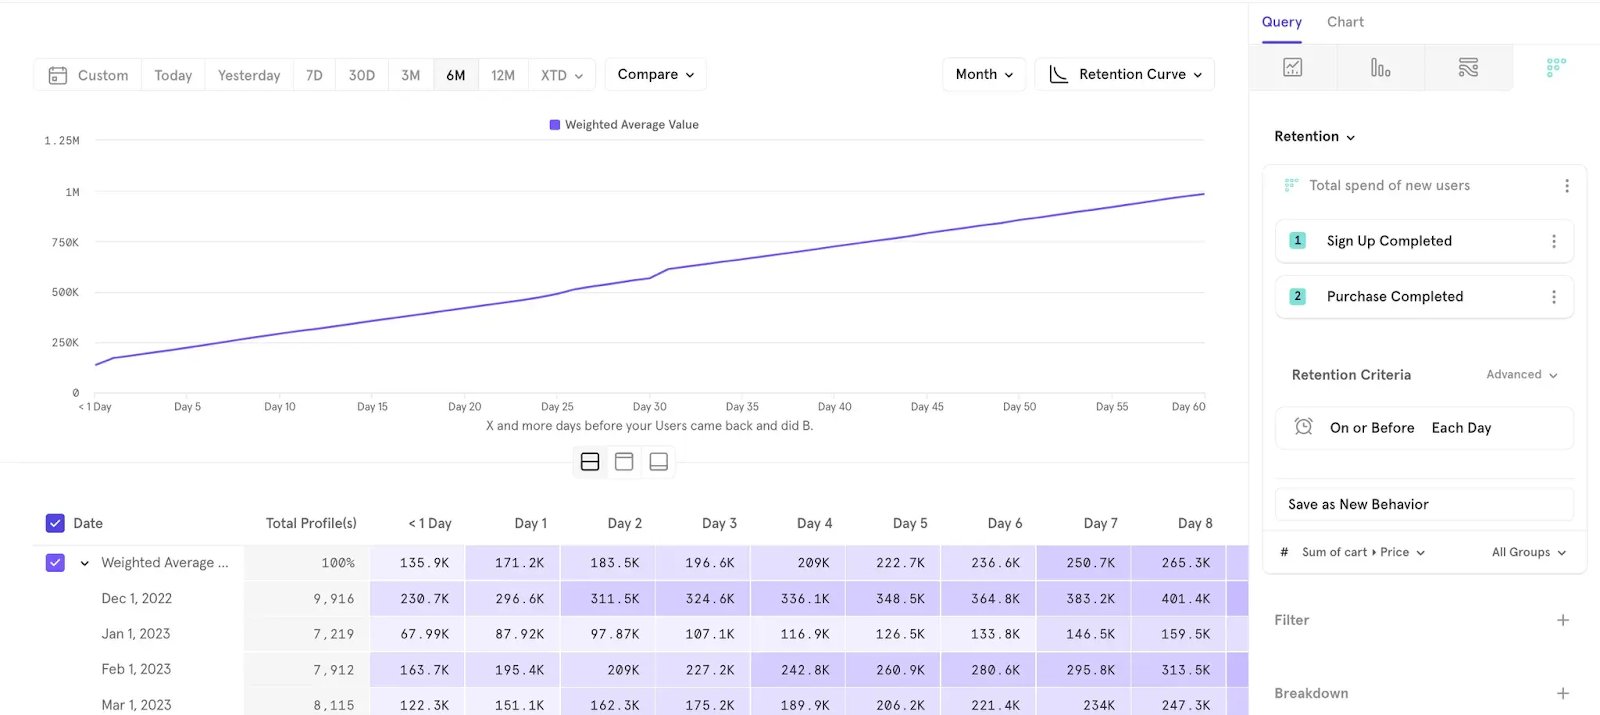
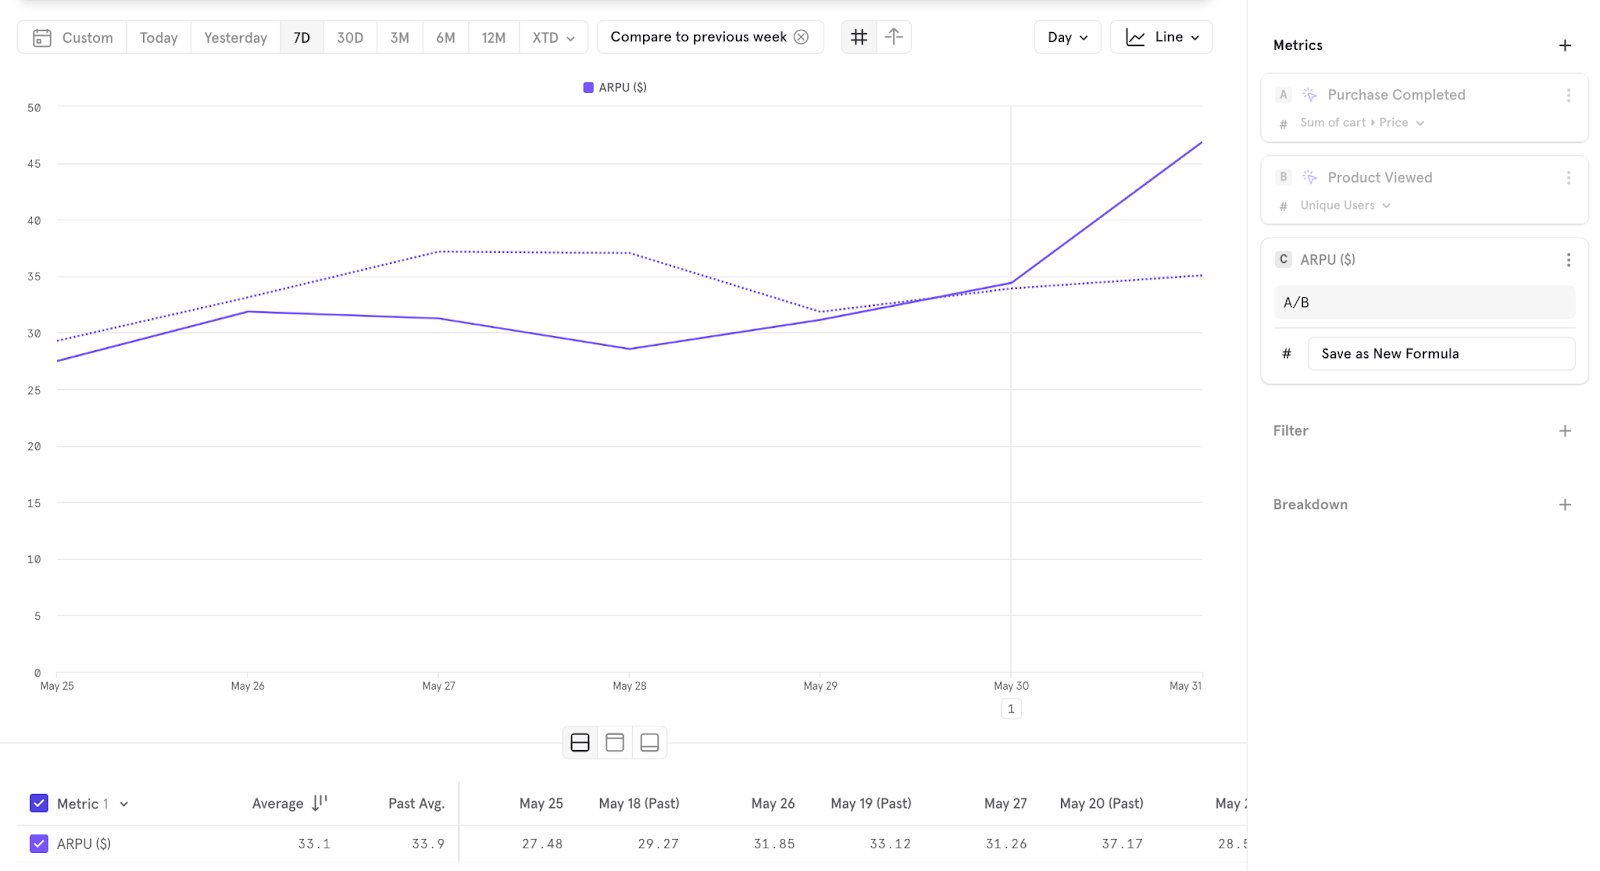
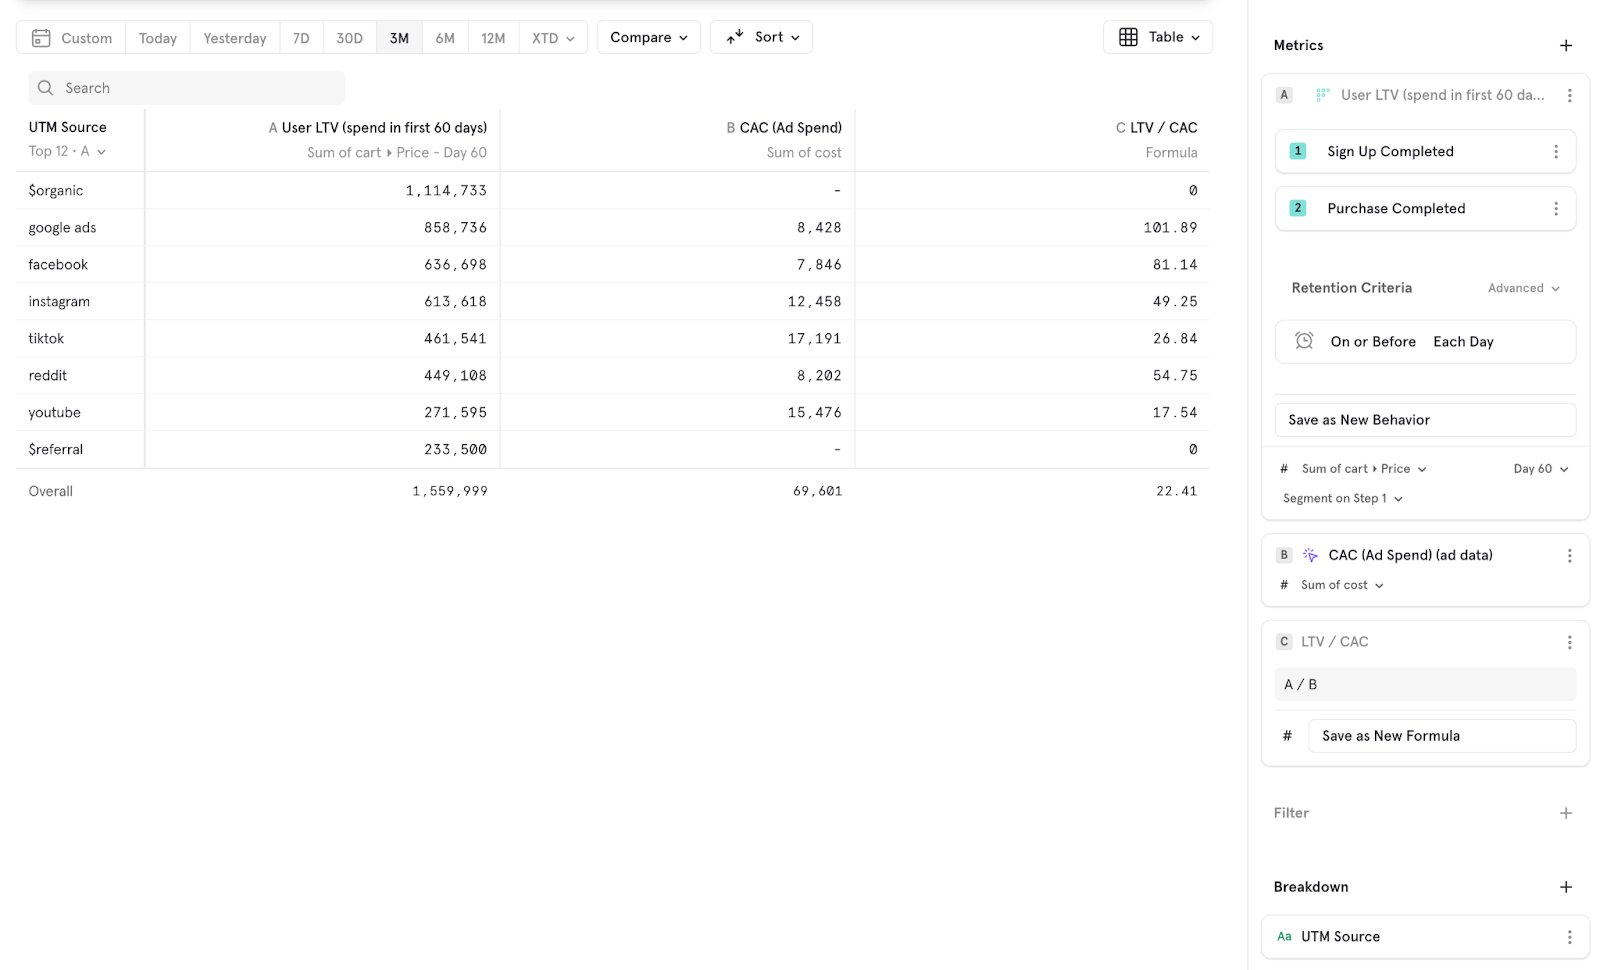
Revenue Analytics can help answer the following example questions for transaction-based business models. Acquisition:- What are D7, D30, and D60 Average Revenue Per User (ARPU)? How has this changed month over month?
- Which acquisition channels bring customers with the highest Life Time Value(LTV)?
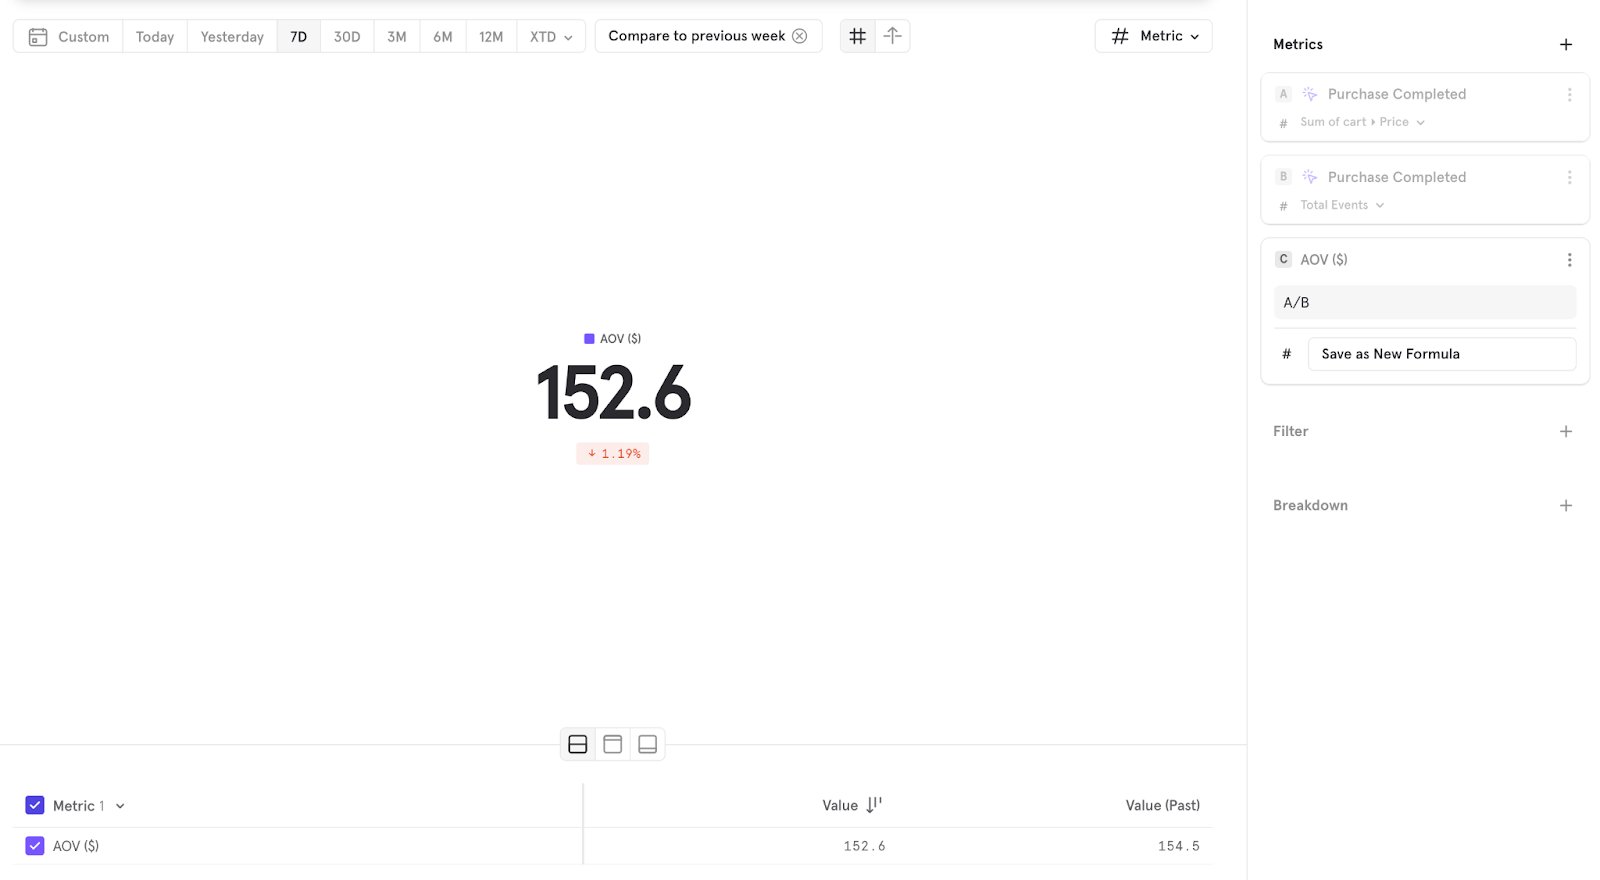
- What is the Average Order Value (AOV) of users who went through the 5-step purchase funnel versus those who did the 3-step funnel?
- Where is revenue dropping in the 5-step purchase funnel?
- What is the revenue split across the various categories? How has this changed year-over-year?
- How does the revenue generated by first-time buyers compare to that of returning customers during major sales events such as Black Friday?
- Which are our most effective marketing channels, such as those with the highest Total Revenue to Customer Acquisition Cost(CAC) ratio?
- What is the change in the AOV after the launch of a 10% off promotional discount?
Building the Metrics
Total Revenue: Calculated as the Sum of Revenue made across all purchases.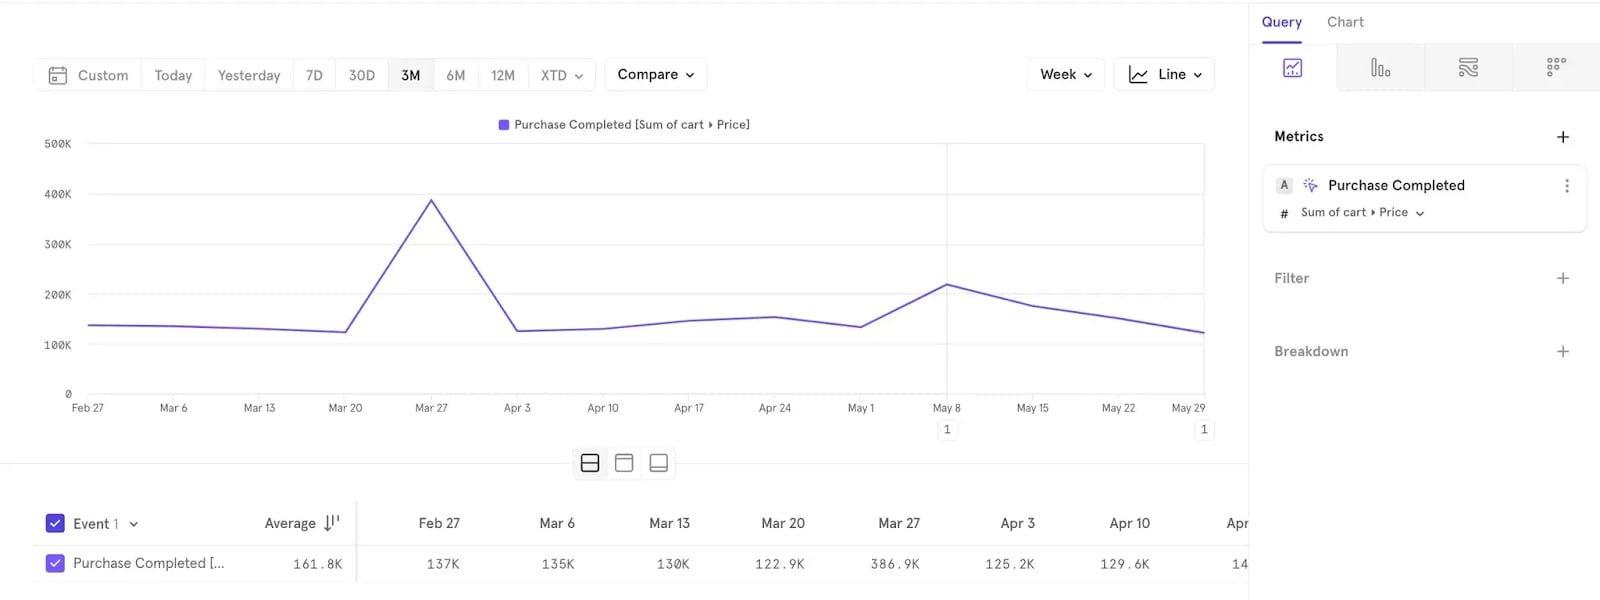
Subscription-based Business Models
Revenue Analytics can help answer the following example questions for subscription-based business models. General revenue What is our current Annual Recurring Revenue(ARR)? How has this changed over time? What’s our current Net Revenue Retention (NRR)? Understanding upgrades/churns What are the top accounts that have upgraded or churned? What is the average engagement (e.g., Viewed Reports/ARR) for accounts that have upgraded versus churned? Should engagement be a leading indicator? Feature usage by plan or revenue bucket What is the feature usage and adoption, broken down by plan type? What is the ‘time to activation’ for accounts in various revenue buckets? Impact of product initiatives We improved our growth plan last year. How many accounts have come in through our basic plan in the last 12 months? They could be on other plans today. We launched a new offering to upsell customers. Is there a correlation between adoption of the feature and upsell revenue?Building the Metrics
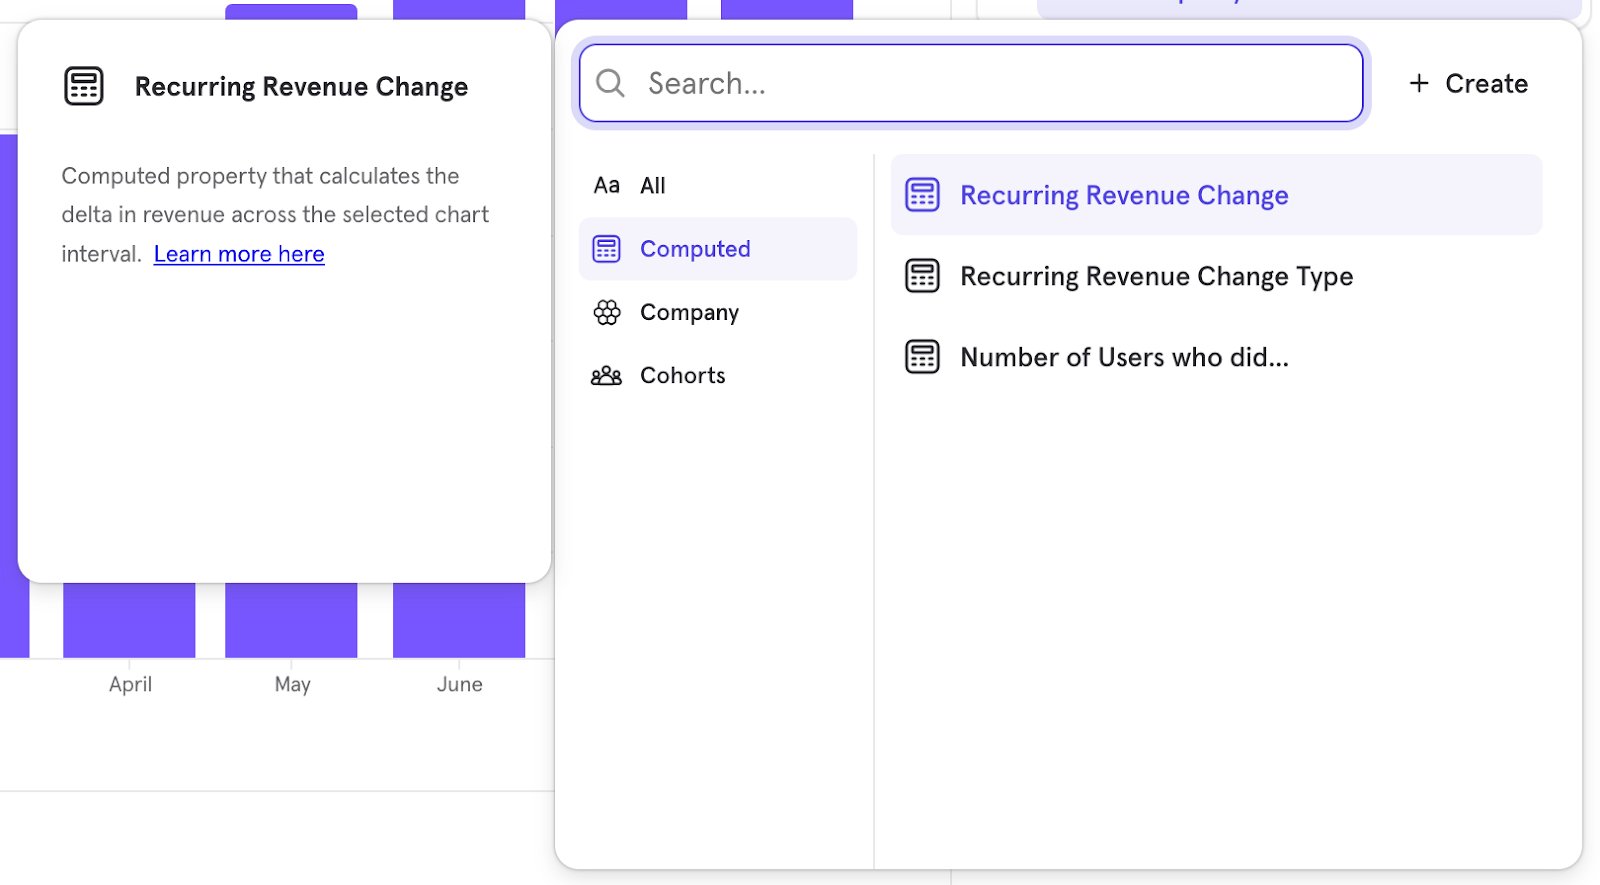
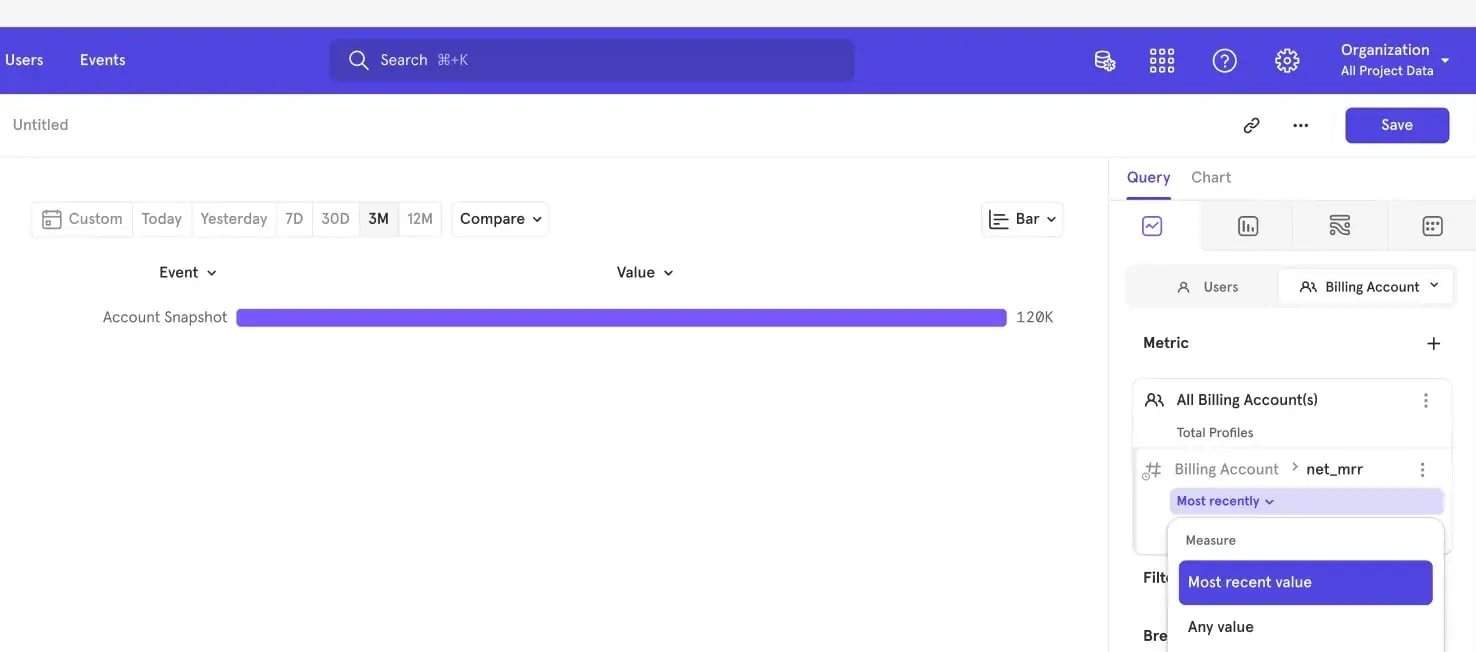
Revenue Analytics makes use of two new computed properties to create subscription revenue metrics. The model is built by comparing two data points:- Recurring Revenue Change: looks at the ‘numerical difference’ between the 2 values
- Recurring Revenue Change Type: tells you the ‘type of change’ listed below:
- 20 → 5 = Downgrade (positive to less positive)
- 5 → 0 = Churn (positive to zero)
- 0 → 5 = New (zero to positive)
- 5 → 20 = Upgrade (positive to more positive)
- 5 → 5 = Flat (no change)
The Recurring Revenue Change and Recurring Revenue Change Type computed properties requires the use of Historical Profile Values imported via Warehouse Connectors.
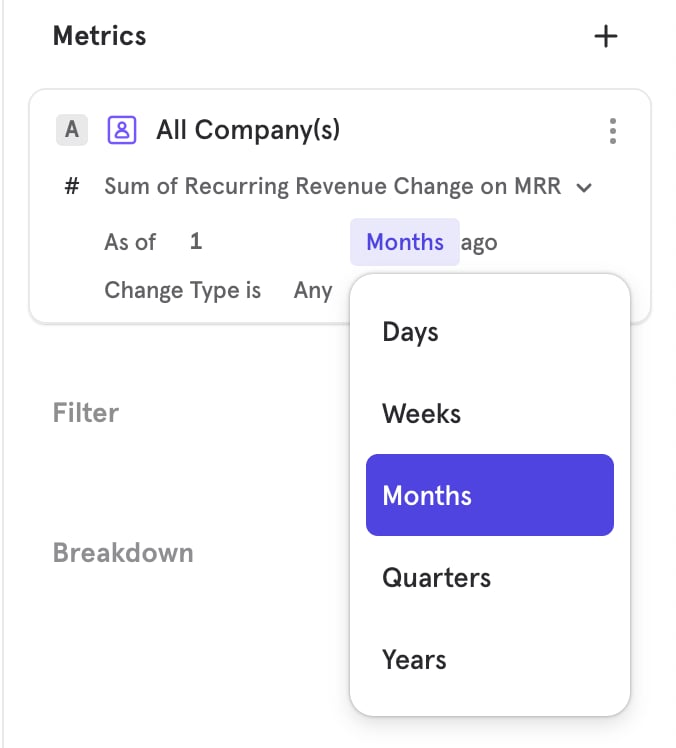
- Time lets you analyze based on the past number of months, which allows you to determine “What should today’s value be compared versus 1 month ago?”, for example.
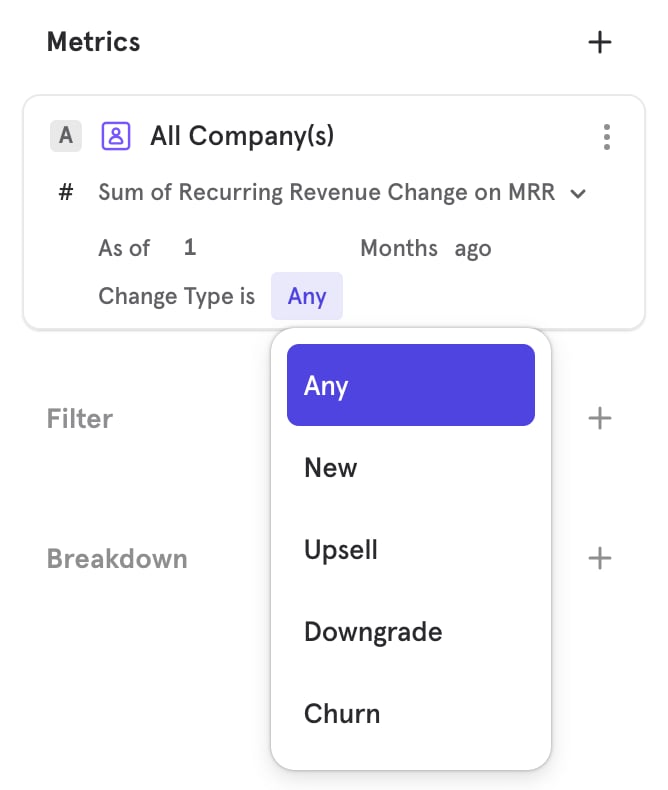
- Change Type enables you to look at the incremental revenue for different types of accounts, whether New, Upsell, Downgrade, or Churn.
- NRR > 100% → Existing customers are being retained and the user base is growing
- NRR < 100% → Existing customers are a leaky bucket and we are not able to upsell them
- Formula:
- Current MRR from Existing Biz / Prior MRR
- (Prior MRR from Existing Biz + (Upsell MRR - Downgrade MRR) ) / Prior MRR
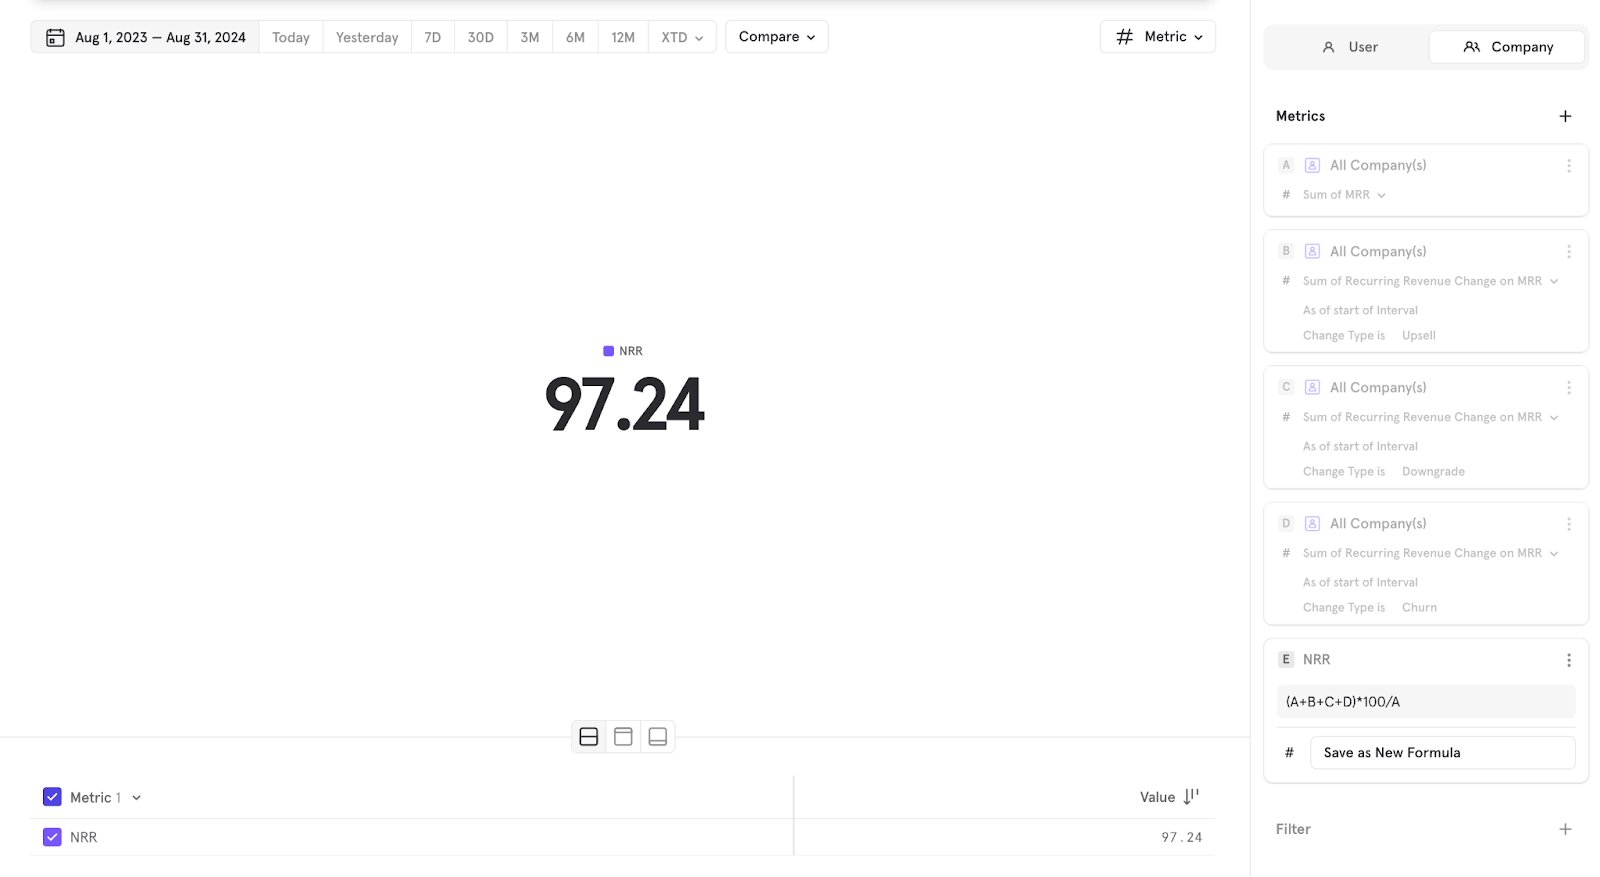
- Formula
- 1 - ( (Current MRR from Existing Biz - Upsell MRR) / Prior MRR )
- Current MRR / Prior MRR
- New Revenue: you want this to go up since this is net - new money (land motion)
- Upsell Revenue: you want this to go up, too, since this is also net - new money (expand motion)
- Downgrade / Lost Revenue: you want this to be minimal
- Flat Renewal: you want this pie to keep growing as you land more logos.
FAQ
Can all customers use these features?
Can all customers use these features?
Only customers using the Warehouse Connectors get access to these features.
What should be the shape of the data to analyze these metrics?
What should be the shape of the data to analyze these metrics?
Once you set the Warehouse Connectors, be sure that you have Mirror Mode turned on to ensure your data is 100% in sync with the warehouse, even if the warehouse data is updated:For transaction-based models - Send purchase value as an event property on every purchase event. Example:
{"event_name": "Purchase completed", "properties": {"item": "clothing", "price": 100}}For subscription-based models - Send a monthly snapshot of the revenue per user/ account as a Historical Profile Property. If a user/account is not active, set the revenue data to zero for the immediate month following so we can tag this as a churned user/account.We have multiple SKUs per account, each with its own contract. Can we send this as a revenue object property for an account?
We have multiple SKUs per account, each with its own contract. Can we send this as a revenue object property for an account?
We do not support profile history for object-type properties. To be able to look at revenue per SKU, we recommend sending each SKU revenue as a historical numerical property.If you have 5 SKUs, send 5 historical properties (SKU_revenue_1, SKU_revenue_2, …, SKU_revenue_5).