The Experiment Report is a separately priced product add-on. It is currently only offered to those on the Enterprise Plan. See our pricing page for more details.Customers who have not purchased the Experiment add-on will be able to create up to 3 experiments per project. Please note that creation is irreversible, so you would not be able to delete experiments. If you are interested in exploring the features fully, you can request a trial from your account team.
Why Experiment?
Experimentation helps you make data-driven product decisions by measuring the real impact of changes on user behavior. Mixpanel is an ideal place to run experiments because all your product analytics data is already here, providing you with comprehensive insights into how changes affect your users’ journey.Prerequisites
Before getting started with experiments:- Exposure Event Tracking: Implement your experimentation events
- Baseline Metrics: Ensure that Mixpanel is already tracking your key metrics
Overview & Workflow
Experiment Process
Plan → Setup & Launch → Monitor → Interpret Results → Make Decisions- Plan: Define hypothesis, success metrics, and test parameters
- Setup & Launch: Configure experiment settings and begin exposure
- Monitor: Track experiment progress and data collection
- Interpret Results: Analyze statistical significance and lift
- Make Decisions: Choose whether to ship, iterate, or abandon changes
Plan Your Experiment
Before creating an experiment report, ensure you have:- A clear hypothesis about what change will improve which metric
- Defined primary success metrics (and secondary/guardrail metrics)
- Estimated sample size and test duration requirements
- Proper exposure event tracking implemented
Setup & Launch Your Experiment
Step 1: Select an Experiment
Click ‘New Experiment’ from the Experiment report menu and select your experiment. Both experiments run through Mixpanel Feature Flags and experiments tracked via exposure events are detected and populated in the dropdown. To keep the dropdown focused on experiments you’re likely to care about, we hide Mixpanel Feature Flag experiments once their flag is archived, and we hide exposure-event experiments that haven’t received an exposure event in the last 30 days. To analyze an exposure-event experiment beyond that window, you can hard-code the experiment name by typing$experiment:Experiment name as a filter or breakdown property, where Experiment name is the value of whichever property you configured as the experiment name on your exposure events.
Two kinds of experiments can be analyzed in the experiment report: experiments run through Mixpanel Feature Flags with the Experiment type, and experiments tracked via exposure events (i.e.,
$experiment_started). Read more on how to track experiments here.Step 2: Choose the ‘Control’ Variant
Select the ‘Variant’ that represents your control. All your other variant(s) will be compared to the control, i.e, how much better they perform compared to the control variant.Step 3: Choose Success Metrics
Choose the primary metrics of success for the experiment. You can choose from either saved Mixpanel metrics or create a new metric leveraging the query panel. You can also add secondary metrics and guardrail metrics as required.Step 4: Select the Test Duration
Enter either the sample size (the number of users to be exposed to the experiment) or the minimum number of days you want the experiment to run. This will determine the test duration. Once the sample size or days are complete, you can conclusively read the experiment results and make a decision.Step 5: Confirm other Default Configurations
Mixpanel has set default automatic configurations, seen below. If required, please modify them as needed for the experiment- Experiment Model type: Sequential
- Confidence Threshold: 95%
- Experiment Start Date: Date of the first user exposed to the experiment
Experiment JSON Parameters
Each variant can optionally carry a value in addition to its name — either a string or a JSON object. The variant name is what your code switches on to render the right experience. The value is configuration data the SDK returns alongside the assignment, so you can remotely control parameters of your app or site (copy, colors, thresholds, layout configs, pricing, etc.) without a code deploy. For example, a variant namedtreatment might carry a JSON object value like:
Changing Settings Mid-Experiment
Mixpanel analyzes your experiment on the fly, so you can adjust settings at any time if needed. If you notice a configuration mistake - like selecting Frequentist when you meant Sequential - feel free to correct it, even if the experiment has been running for weeks. The one thing to avoid is changing settings because the current results aren’t what you hoped for. If you adjust the confidence level, metrics, or duration in search of a significant result, you’re more likely to find something that looks meaningful but is actually noise. When you roll out that change, it may not deliver the improvement you expected. If you want to test a different configuration, restart the experiment instead. This resets the data and ensures your analysis starts fresh.Monitor Your Experiment
Once your experiment is running, you can track its progress in the Experiments dashboard. Monitor key indicators:- Sample Size Progress: Track how many users have been exposed
- Data Quality: Ensure exposure events are being tracked correctly
- Guardrail Metrics: Watch for any negative impacts on important metrics
- External Factors: Note any external events that might affect results
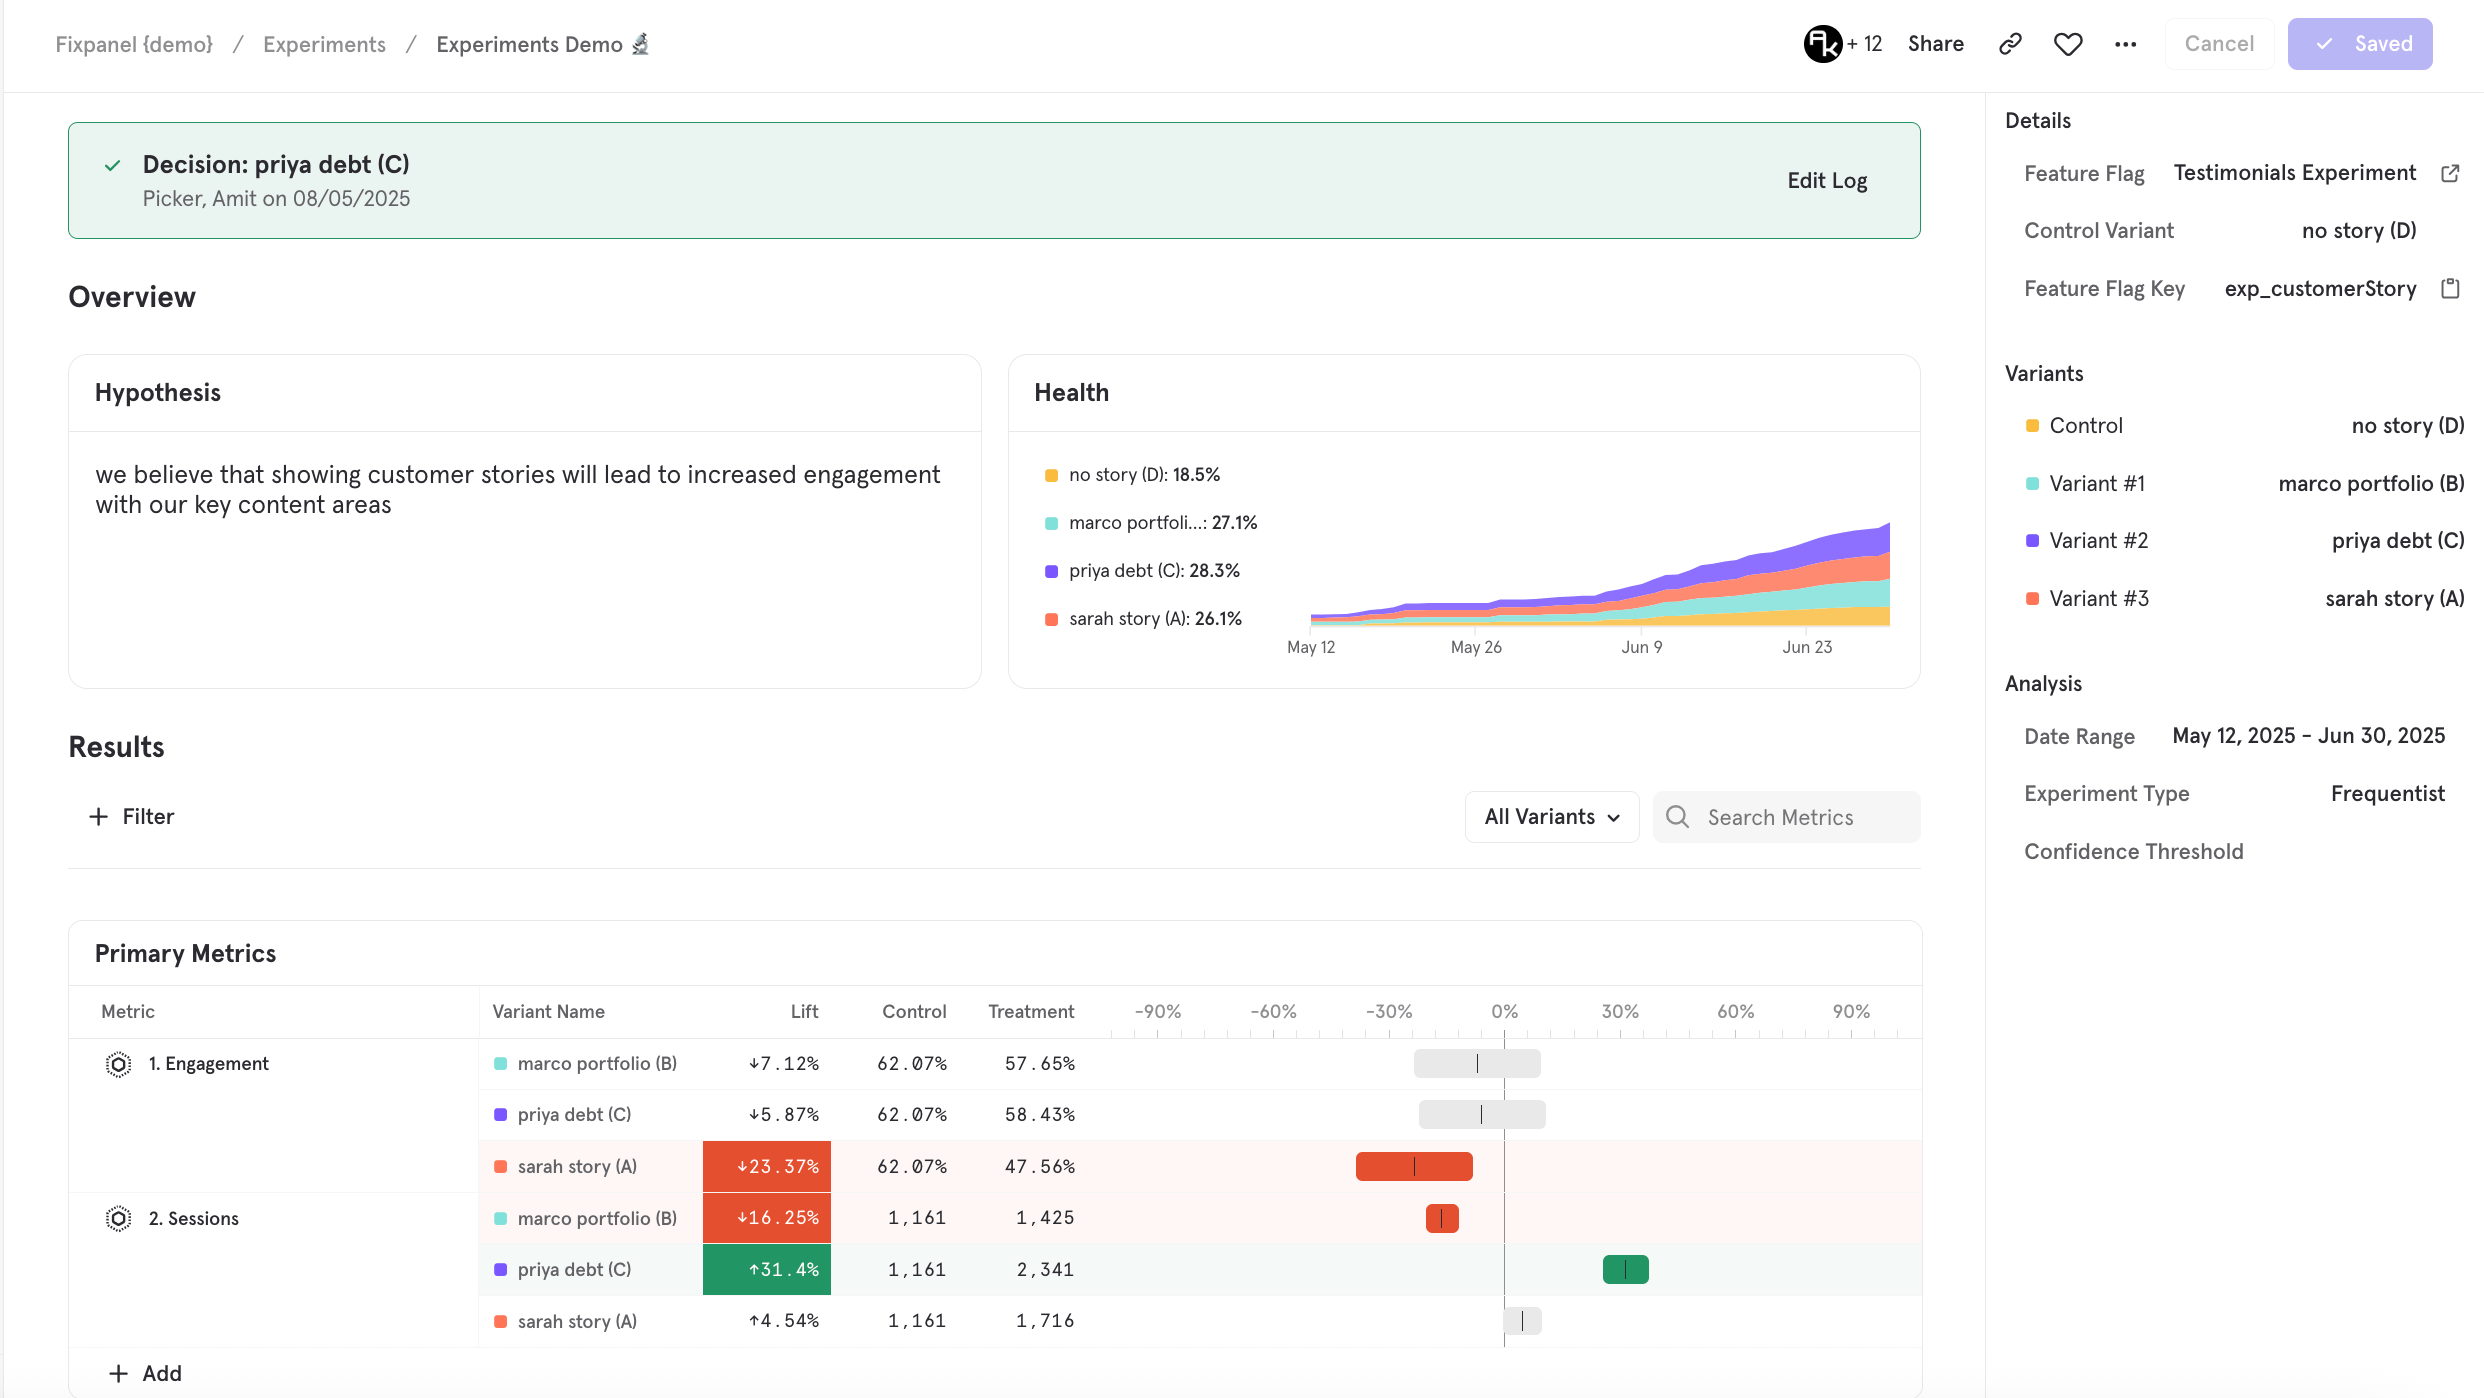
Interpret Your Results
The Experiments report identifies significant differences between the Control and Variant groups. Every metric has two key attributes:- p-value: this shows if the variants’ delta impact vs the control is statistically significant
- lift: the variants’ delta impact on the metric vs control
- Positive differences, where the variant value is in the target direction compared to the control, are highlighted in green
- Negative differences, where the variant value is opposite the target direction compared to the control, are highlighted in red
- Statistically insignificant results remain gray
Hover over a value in a metric row to see more detail behind the numbers and to view the metric in Insights.
How do you read statistical significance?
Statistical significance (p-value) helps you determine whether your experiment results are likely to hold true for the full rollout, giving you confidence in your decisions.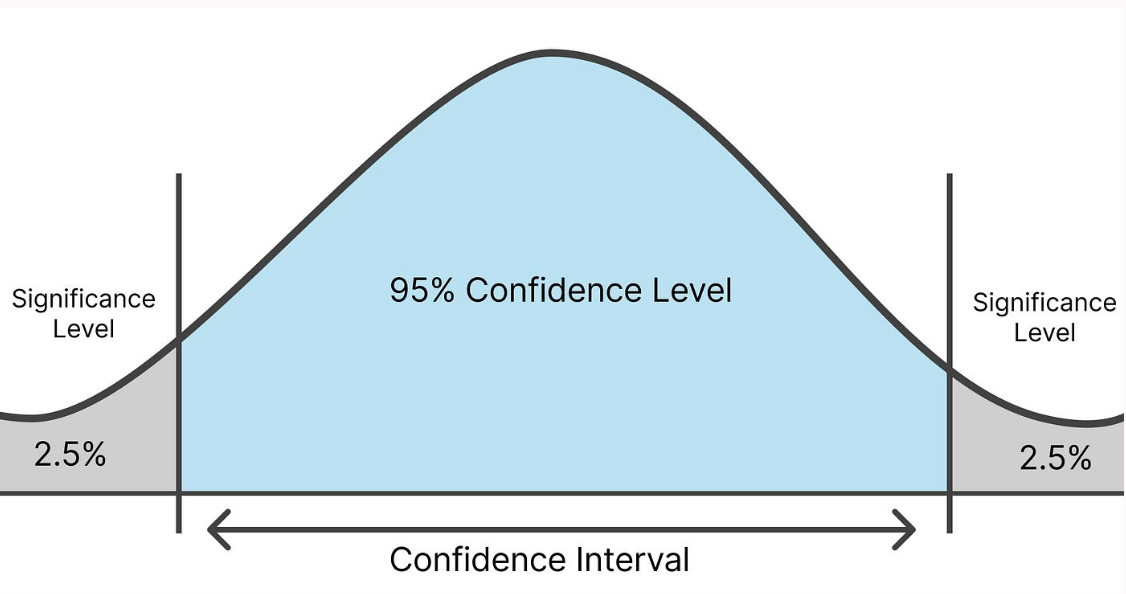
Statistical Significance Calculation
Mixpanel uses Frequentist statistical methods to compute p-values and confidence intervals. The specific approach depends on your metric type and experiment model. Metric Types and Their Distributions: Mixpanel categorizes metrics into four types, each using different statistical distributions:-
Total Events Metrics: Use normal distribution of per-user event counts
- Examples: Total purchases, total page views
- Variance is calculated directly from the distribution of per-user event counts
-
Total Sessions Metrics: Use Poisson distribution
- Variance equals the mean (characteristic of Poisson distributions)
-
Rate Metrics (Conversion rates, Retention rates): Use Bernoulli distribution
- Examples: Signup conversion rate, checkout completion rate, 7-day retention
- Models binary outcomes (did/didn’t convert) across your user base
-
Value Metrics (Averages, Sums of properties): Use normal distribution approximation
- Examples: Average order value, total revenue, average session duration
- Calculates variance using sample statistics
- Calculate group rates for control and treatment
- Estimate variance using the appropriate distribution
- Compute standard error from variance and sample size
- Calculate Z-score measuring how many standard errors apart the groups are
- Derive p-value from Z-score using normal distribution
- Uses continuous monitoring with adjusted significance thresholds with mSPRT method
- Allows for early stopping when significance is reached
- More conservative calculations to account for multiple testing
- Uses traditional hypothesis testing with fixed sample sizes
- Formula: Max Significance Level (p-value) = [1-CI]/2 where CI = Confidence Interval
- p ≤ 0.025: results are statistically significant for this metric, i.e, you can be 95% confident in the lift seen if the change is rolled out to all users.
- p > 0.025: results are not statistically significant for this metric, i.e, you cannot be very confident in the results if the change is rolled out broadly.
Example: E-commerce Checkout Experiment
To illustrate how these calculations work in practice, let’s walk through a concrete example. Scenario: Testing a new checkout UI on an e-commerce site with 20 users (10 control, 10 treatment). Results:- Control group: 5 users converted (50% conversion rate), average cart size $60
- Treatment group: 6 users converted (60% conversion rate), average cart size $67
- Group rates: Control = 0.5, Treatment = 0.6
- Variance calculation: Control = 0.5 × (1-0.5) = 0.25, Treatment = 0.6 × (1-0.6) = 0.24
- Standard error: Combined SE = √((0.25/10) + (0.24/10)) = 0.221
- Z-score: (0.6 - 0.5) / 0.221 = 0.45
- P-value: ~0.65 (not statistically significant)
- Group means: Control = $60, Treatment = $67
- Variance calculation: Uses the sample variance of cart values in each group
- Standard error: Calculated from combined variance and sample sizes
- Z-score and p-value: Computed using the same Z-test framework
How do you read lift?
Lift is always calculated using exposures (users assigned to a variant) as the denominator — not the denominator you may see in other tabs like Totals or Chart. For funnel metrics, this means the lift denominator differs from the funnel conversion rate denominator. See the FAQ “Why does the lift in Results disagree with the conversion rate in Totals or Chart?” for a worked example.
$experiment_started event for that variant):
Total Events Metrics:
- Numerator: Total event count in the variant
- Denominator: Number of users exposed to the variant
- Group Rate: Total count ÷ Number of users exposed
- Variance: Calculated directly from the per-user event counts, treated as a continuous variable
- Example: If the treatment group has 150 total purchases from 100 exposed users, the group rate = 1.5 purchases per user
- Numerator: Total session count in the variant
- Denominator: Number of users exposed to the variant
- Group Rate: Total count ÷ Number of users exposed
- Variance: Equal to the mean (Poisson distribution property)
- Numerator: Number of users who converted (or were retained) in the variant
- Denominator: Number of users exposed to the variant
- Group Rate: Conversions ÷ Exposures
- Variance: Calculated using Bernoulli distribution: p × (1-p)
- Example: If 25 out of 100 exposed users convert, group rate = 0.25 (25%). Note that this denominator is exposures — not funnel entrants. This is different from the funnel conversion rate you see in the Totals or Chart tabs, which uses funnel entrants as the denominator.
- Numerator: Sum of property values across all users in the variant
- Denominator: Number of users exposed to the variant
- Group Rate: Sum of property values ÷ Number of users exposed
- Variance: Calculated from the distribution of individual property values
- Example: If the treatment group spent $5,000 total from 100 users, the group rate = $50 average per exposed user
Metrics with a Group Identifier: When you change a metric’s group identifier from Users to a group key (e.g., Company), exposures for that metric are counted at the group level. The number of exposed groups is then used for all of that metric’s calculations — normalizing group rates, computing variance, and determining statistical significance. For example, if a metric is set to aggregate by Company and 200 companies have been exposed to the treatment, the group rate is calculated as the total metric value divided by those 200 exposed companies, not by the number of individual users.
Revenue per User = Total Revenue ÷ Unique Users, Mixpanel uses propagation of uncertainty to estimate variance. This combines the variances of the component metrics (Total Revenue and Unique Users) to calculate the overall metric’s statistical significance. The system assumes metrics in formulas are uncorrelated for these calculations.
Segment your results
Segmentation lets you break your experiment results down by a property (such as country, platform, plan type, or device) to see how the treatment effect varies across groups of users. This is useful for spotting cases where a change helps one segment but hurts another, which an aggregate result can hide. How to use it: Use the breakdown picker above the results table to choose a property to segment by. Mixpanel then computes a separate result (lift, p-value, and confidence) for each value of that property and lays them out in a table, so you can compare the variants within every segment. Each segment row reads exactly like the overall results: green for a significant positive difference, red for a significant negative one, and gray for differences that aren’t statistically significant. This breakdown happens natively inside the Experiment report and is distinct from clicking Analyze on a metric, which opens a separate Insights report (see Diagnosing experiments further).The risk of post-hoc segmentation
Breaking results down after an experiment has run is a form of post-hoc analysis, and it carries a real statistical risk. Every additional segment you inspect is another chance to see a “significant” result that is actually just noise. This is the same multiple-comparisons problem described under Bonferroni and Benjamini-Hochberg, but it’s especially easy to fall into when you slice the same results many different ways looking for something that “worked.” This practice is often called p-hacking: if you test enough segments, you will eventually find one with a low p-value purely by chance. Reporting that segment as a win, and constructing a story around why that particular group responded, can lead you to ship a change based on a false positive.Why Mixpanel corrects segmented results by default
Because segmenting multiplies the number of comparisons being made, Mixpanel corrects segmented results by default. When you don’t already have a Multiple Testing Correction enabled, adding a breakdown turns on the Benjamini-Hochberg correction across its segments. If you already have Bonferroni enabled, Mixpanel keeps it rather than switching to Benjamini-Hochberg, since Bonferroni is the stricter check. Either way the correction is recommended but optional, and you can turn it off from the results if you want to see the uncorrected numbers. Benjamini-Hochberg controls the false discovery rate, the share of your flagged winners that are actually false positives. It does this by making the significance threshold stricter as you add more segments, so a segment still highlighted as a winner after correction is more trustworthy. Segments that only looked significant because you tested many of them are filtered out. See the Benjamini-Hochberg Correction section for a worked example of how the procedure ranks and thresholds p-values. This correction operates on the values in your breakdown, which is a different axis from the Multiple Testing Correction you apply across metrics and variants. That means adding more breakdown values doesn’t inflate your false positive rate.When do we say the Experiment is ready to review?
Once the ‘Test Duration’ setup during configuration is complete, we show a banner that says “Experiment is ready to review”. Test Duration can be either of two options:- Sample size to be exposed
- Number of days you’d like to run the experiment
Diagnosing experiments further in regular Mixpanel reports
Click ‘Analyze’ on a metric to dive deeper into the results. This will open a normal Mixpanel insights report for the time range being analyzed with the experiment breakdown applied. This allows you to view users, view replays, or apply additional breakdowns to further analyze the results. You can also add the experiment breakdowns and filters directly in a report via the Experiments tab in the query builder. This lets you do on-the-fly analysis with the experiment groups. Under the hood, the experiment breakdown and filter work the same as the Experiment report.Multiple Environments
Multiple Environments lets you treat separate Mixpanel projects as development, staging, and production environments for the same experiment or feature flag. Build and iterate on an experiment (and its underlying flag) in one project, then push it to another project when you’re ready — without recreating it by hand. Linked experiments and flags stay connected so you can continue pushing updates over time.Other Environments Selector
The “Other Environments” selector appears under the Configuration tab of an experiment, inside the More section. This panel lets you manage an experiment’s links to copies of itself in other projects.Pushing changes
Pushing changes copies the full configuration of the source (original) experiment to the linked destination experiment in the other project. Any changes that exist only on the destination experiment will be overwritten.Other Environments Menu
This menu lists the experiments in other projects that are linked to the current experiment. From here, you can navigate to a linked experiment, push the source experiment’s current configuration to it, or remove the connection.Duplicate To Project
To duplicate an experiment to another project, open the Other Environments menu and select Duplicate To Project. In the dialog, choose the destination project. This flow is for duplicating across projects only — to duplicate within the same project, use the existing Duplicate option within the experiment’s overflow (...) menu in the top-right of the experiment page.
Once duplicated, the new experiment is linked to the original and can be managed from the “Other Environments” menu.
Feature Flags
If an experiment is linked to a Mixpanel Feature Flag, the underlying flag cannot be duplicated on its own from the Feature Flags page — use the experiment’s Duplicate flow to copy the experiment and flag together. If your experiment uses a third-party flag instead, you can duplicate the experiment directly; no flag duplication step is involved. When duplicating an experiment that is linked to a Mixpanel Flag to another project, you will be prompted to confirm whether you also want to duplicate the linked flag. If you do, the new experiment will be linked to the new flag, and the new flag will also appear in the “Other Environments” menu of the original flag. When pushing changes, if both the source and destination experiments are linked to flags that are also linked (i.e., you chose to duplicate the flag as well), you can choose to push any changes from the source flag to the destination project’s flag at the same time.Permissions
To duplicate an experiment to another project, you need permission to create and edit experiments in both the source and destination projects. The required permission level in the destination project is the same as what’s needed to manually create a new experiment there — governed by that project’s roles and custom roles.What to expect after duplicating
When an experiment is duplicated to another project, time-based settings (such as the experiment period and day counts) reset to the day the duplicate was created — the same behavior as duplicating within a project. If your experiment targets a cohort, Mixpanel assumes the event properties referenced by that cohort exist in the destination project. It does not validate property availability at copy time, so verify that your destination project collects the same events and properties before running the experiment there.Removing a connection
Removing an inter-project connection from the “Other Environments” menu unlinks the two experiments — it does not delete the experiment in the destination project. The copied experiment remains in the destination project and continues to function independently; it simply loses its link to the original.Billing across projects: You aren’t double-charged for using the same feature flag across multiple projects. Mixpanel charges based on active feature flag keys, so the same flag-key shared across projects is counted once.
Advanced Statistical Methods
Mixpanel offers several advanced statistical options to help you get more reliable experiment results. These features address common challenges in experimentation: controlling for multiple comparisons, handling outliers, validating experiment setup, and reducing variance to reach significance faster.Methods at a Glance
Bonferroni Correction
When you track multiple metrics in an experiment, or test multiple variants against a control, you increase the chance of seeing a false positive. This is similar to rolling multiple dice: there’s only a 1-in-6 chance of rolling a six with one die, but if you roll 10 dice, the chance that at least one shows a six is much higher. The same principle applies to experiment metrics. At a 95% confidence level, each metric has a 5% chance of showing a significant result by pure chance. But when you’re tracking many metrics, the probability that at least one of them shows a false positive increases substantially. Bonferroni Correction addresses this by making the significance threshold stricter. When enabled, Mixpanel divides your confidence threshold by the number of comparisons being made (metrics × non-control variants). For example, if you have 3 metrics and 2 treatment variants, that’s 6 total comparisons. If you selected a 95% confidence level, we’d increase the threshold to about 99% to compensate. When to use Bonferroni Correction:- You’re tracking multiple primary metrics and want to reduce false positive risk
- You have multiple treatment variants competing against control
- You want higher confidence that significant results are real
Benjamini-Hochberg Correction
Benjamini-Hochberg (BH) is a more balanced alternative to Bonferroni for handling multiple comparisons. Instead of controlling the probability that any significant result is a false positive (the family-wise error rate that Bonferroni targets), BH controls the false discovery rate — the expected proportion of your “winners” that are actually false positives. This better matches how experiment decisions are actually made. You only ship winners, so what matters is the share of those winners that are real. If you have 4 significant metrics and on average 1 is a false positive, your false discovery rate is 25% — regardless of how many metrics you tested in total. How it works: Mixpanel ranks all p-values for the experiment from smallest to largest. Each p-value is compared to a threshold of (rank / total tests) × α, where α is determined by your confidence level. The largest p-value that passes its threshold — and every smaller p-value — is marked significant. For example, with 5 metrics at a 95% confidence level (α = 0.05):
Under BH, the first three metrics are significant. Under Bonferroni at the same confidence level, only Revenue would pass.
When to use Benjamini-Hochberg Correction:
- You’re tracking many metrics and want correction without sacrificing too much statistical power
- You’re comfortable accepting that a small proportion of your significant results may be false positives, in exchange for catching more real effects
- You want a correction method that scales gracefully as you add metrics
Winsorization
Outliers can distort experiment results, especially for revenue or value-based metrics. If most customers have cart sizes under $100 but one customer in the treatment group spends $100,000, this single extreme value could skew all your results and make it harder to detect real effects. Winsorization addresses this by capping extreme values at a specified percentile. When enabled, you select a percentile threshold (such as 5%). Mixpanel then finds the values at the top and bottom of that percentile range and caps any values beyond those limits. In the example above, if the 95th percentile corresponds to $90, then the $100,000 purchase would be treated as $90 for the analysis. When to use Winsorization:- Your metrics have high variance due to extreme values
- You’re measuring revenue, order value, or other metrics where outliers are common
- You want to understand the effect on typical users rather than being influenced by rare extremes
Health Checks
Before trusting your experiment results, it’s important to verify that your experiment was set up correctly. Mixpanel offers two health checks to help you validate your experiment’s integrity.Sample Ratio Mismatch (SRM)
When randomly assigning users to control or treatment groups, you expect the split to roughly match your allocation targets. If you configured a 50/50 split but ended up with 60% in control and 40% in treatment, something may have gone wrong. Small imbalances can happen by random chance, but larger mismatches often indicate a bug in your assignment logic, tracking implementation, or user bucketing. SRM uses a Chi-squared test to determine whether the observed split is likely due to chance or signals an actual problem. If Mixpanel detects a statistically significant sample ratio mismatch, you’ll see a warning. We recommend investigating the root cause of the mismatch and restarting the experiment after fixing it.Pre-Experiment Bias Analysis
When you see lift in your experiment, you want to be confident it’s caused by your treatment—not by pre-existing differences between the groups. Pre-Experiment Bias helps you check this. The idea is simple: Mixpanel runs the same statistical analysis on 2 weeks of pre-experiment data. It looks at how each variant’s users behaved before they were exposed to the experiment, using the same metrics you’re measuring during the experiment. If the groups were properly randomized, there should be no significant difference in the pre-experiment period—users hadn’t been treated yet, so nothing should cause a difference. But if Pre-Experiment Bias finds statistically significant lift in the pre-experiment data, that’s a red flag. It suggests the groups weren’t equivalent to begin with, which means any lift you see during the experiment might not be caused by your treatment. Example: Your experiment shows the treatment group has 15% higher engagement. But Pre-Experiment Bias reveals this same group already had 12% higher engagement before the experiment started. This suggests your randomization may have assigned more naturally-engaged users to treatment, and the lift you’re seeing is largely a pre-existing difference rather than a treatment effect. Pre-Experiment Bias failing for a metric doesn’t necessarily invalidate your experiment. Enabling CUPED may help reduce the impact of pre-experiment bias on the data, allowing you to still analyze the results. You may however want to review your implementation to ensure assignment is not biased towards some users.Common reasons health checks may fail:
- Bugs in the randomization or bucketing logic
- Exposure events not firing consistently across variants
- Users being reassigned to different variants mid-experiment
CUPED (Controlled-experiment Using Pre-Experiment Data)
CUPED is a variance reduction technique that helps you reach statistical significance faster. It uses pre-experiment behavioral data to produce narrower confidence intervals, potentially reducing the time needed to conclude an experiment significantly. The core insight is that users who had high engagement or revenue before the experiment are likely to have high values during the experiment as well. By accounting for this correlation, CUPED can separate the natural variation in user behavior from the effect of your treatment. How it works: For each user, Mixpanel looks at their metric value during a pre-exposure period of your choosing and their metric value during the experiment. If these values are strongly correlated (users with high pre-experiment values tend to have high post-experiment values), CUPED uses this relationship to reduce variance in the experiment results. The mean values remain unchanged—CUPED only tightens the confidence intervals. This is applied to all metric categories: primary, secondary, and guardrail metrics. Configuring the pre-exposure period: When you enable CUPED, you can choose the lookback window under Configuration → CUPED Pre-Exposure Period. The available options are 1 Week, 2 Weeks (default), 4 Weeks, 60 Days, and 90 Days. A longer window queries further back in time, which picks up more users and more historical signal. Choose a window that is long enough to capture your users’ typical behavior — if some users are only active once a month, a 1-week window may miss them entirely. Avoid windows that overlap with previous experiments on the same user population, as shared exposure can reduce sensitivity and introduce bias. That said, a longer window is not always better: behavior from far in the past can be less predictive of current behavior, and users with no activity in the window are assigned a pre-exposure value of zero, which dilutes the variance reduction benefit. Two weeks is a good default for most experiments. Handling users without pre-experiment data: Not all users in your experiment will have activity during the pre-exposure period. New users, or users who simply didn’t perform the relevant event before the experiment, are assigned a value of zero for the pre-exposure metric. This allows all experiment users to be included while still benefiting from variance reduction for users who do have historical data. When to use CUPED:- You have sufficient pre-experiment data for most users in your experiment
- Your metrics have high natural variance between users
- You’re measuring metrics where past behavior predicts future behavior (engagement, revenue, retention)
Looking under the hood - How does the analysis engine work?
$experiment_started to attribute the event to the proper variant.
Implementation for Experimentation
If you’re using Mixpanel Feature Flags, you don’t need to do anything extra to send exposure events — Mixpanel’s SDKs track them automatically when a user is exposed to a variant. Your experiment will show up in the Experiment report as soon as the feature flag is created with the Experiment type. If you’re using a 3rd party feature flagging service or an in-house feature flag system, you can still analyze your experiments in Mixpanel by sending exposure events yourself in the following format: Event Name: “$experiment_started” Event Properties:- “Experiment name” - the name of the experiment to which the user has been exposed
- “Variant name” - the name of the variant into which the user was bucketed, for that experiment
mixpanel.track('$experiment_started', {'Experiment name': 'Test', 'Variant name': 'v1'})
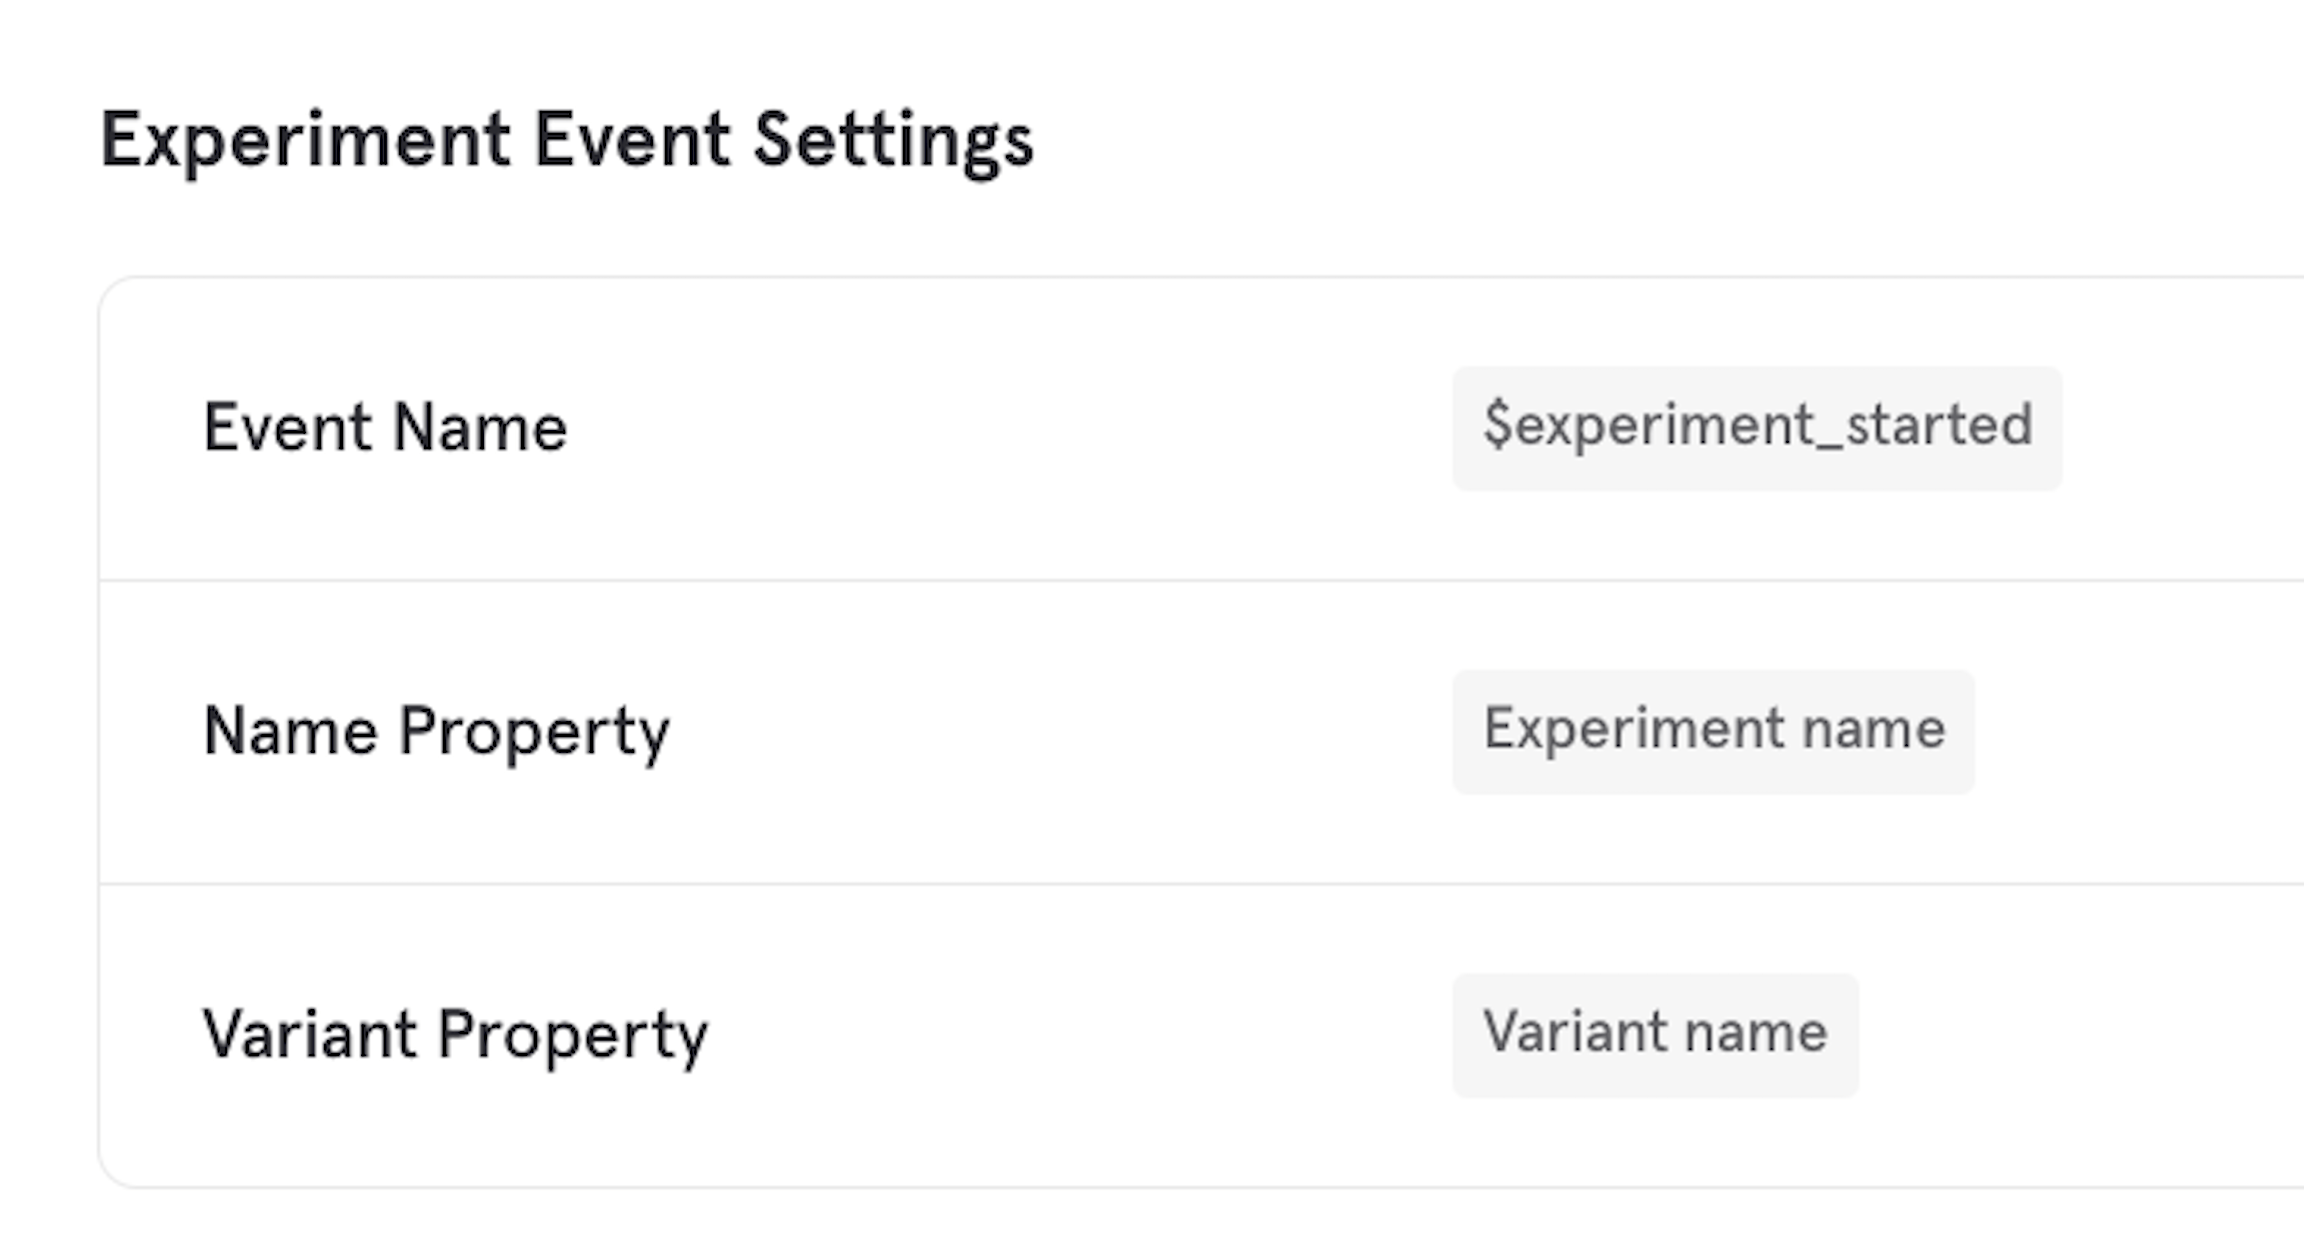
You can specify the event and property that should be used as the exposure event, name, and variant. Go to Settings → Project → Experimentation. This allows you to use an experiment event that you’re already tracking, for example, via a 3rd party feature flagging tool. Note, only string properties should be used for the ‘Name’ and ‘Variant’.
When to track an exposure event?
- An exposure event ONLY needs to be sent the first time a user is exposed to an experiment, as long as the user is always in the initial bucketed variant. Exposure events don’t have to be sent subsequently in new sessions.
- If a user is part of multiple experiments, send a corresponding exposure event for each experiment.
- Send exposure event only when a user is actually exposed, not at the start of a session. For example, if you want to run an experiment on the payment page of a ride-sharing app, you only really care about users who open the app, book a ride, and then reach the payment page. Users who only open the app and do other activities shouldn’t be considered in the sample size. So exposure event should ideally be implemented to track only once the payment page is reached.
- Send exposure details and not the assignment. For example, you begin an experiment on 1st Aug, and 1M users are ‘assigned’ to the control and variant. You do not want to send an ‘exposure’ event for all these users right away, as they have only been assigned to the experiment. It’s possible that some user gets exposed on 4th Aug and some on 8th Aug. You would want to track $experiment_started at the exposure for accurate analysis.
FAQs
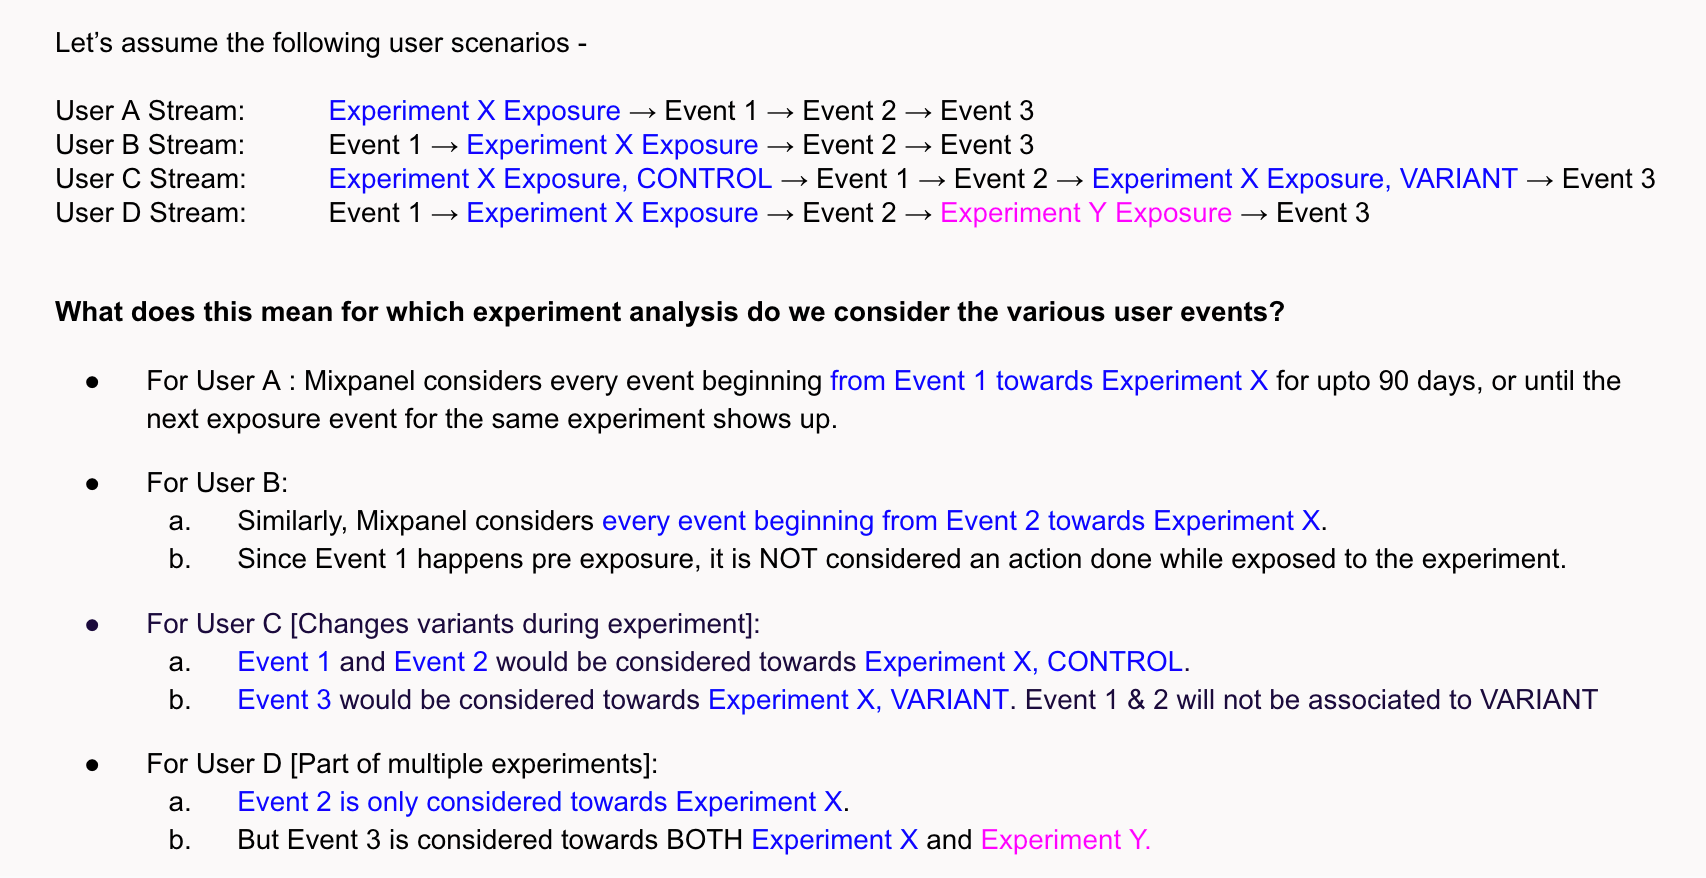
- If a user switches variants mid-experiment, how do we calculate the impact on metrics? We break a user and their associated behavior into fractional parts for analysis. We consider the initial behavior part of the first variant, then once the variant changes, we consider the rest of the behavior for analysis towards the new variant.
- If a user is part of multiple experiments, how do we calculate the impact of a single experiment? We consider the complete user’s behavior for every experiment that they are a part of. We believe this will still give accurate results for a particular experiment, as the users have been randomly allocated. So there should be enough similar users, ie, part of multiple experiments, across both control and variants for a particular experiment.
- For what time duration do we associate the user being exposed to an experiment to impact metrics? After the most recent experiment exposure for a user, we consider that user’s behavior as ‘exposed’ to an experiment for a max of 90 days.
Why does the lift in Results disagree with the conversion rate in Totals or Chart?
This is expected behavior — the two numbers use different denominators and answer different questions. Lift divides conversions by exposures (all users assigned to a variant). Totals/Chart for funnel metrics divides funnel completers by funnel entrants (users who started the funnel). When a variant changes how many users enter the funnel — for example, a new CTA that attracts more (or less qualified) users — the two rates can move in opposite directions. Worked example:- Funnel conversion (Totals/Chart tab): v1 is 28.58% vs control 30.50% — v1 looks worse (−6.3%).
- Per-exposure conversion (basis for Lift): v1 is 6.96% vs control 6.49% — v1 looks better (+7.52%).
Experimentation Pricing FAQ
The Experiment Report is a separately priced product offered to organizations on the Enterprise Plan. Please contact us for more details.
Pricing Unit
Experimentation is priced based on MEUs - Monthly Experiment Users. Only users exposed to an experiment in a month are counted towards this tally.How are MEUs different than MTUs (Monthly Tracked Users)?
MTUs count any user who has tracked an event to the project in the calendar month. MEU is a subset of MTU; it’s only users who have tracked an exposure experiment event (ie,$experiment_started) in the calendar month.
How can I estimate MEUs?
If you actively run experiments, you can look at the number of monthly users exposed to an experiment. Note that the MEU calculation is different if users are, on average, exposed to 30 or more experiments in a month. If not running experiments, below are some rough estimations of MEU’s based on the number of MTUs being tracked to the project.Does it matter how many experiments a user is exposed to within the month?
We’ve accounted for an MEU to be exposed to up to 30 experiments per month. If the average number of experiment exposure events per MEU is over 30, then the MEUs will be calculated as the total number of exposure events divided by 30.What happens if I go over my purchased MEU bucket?
You can continue using Mixpanel Experiment Report, but you will be charged a higher rate for the overages.Can I analyze experiments prior to the purchase date?
No. You can only analyze experiments starting from your experimentation purchase date. This means that the date used in your experiment cannot start prior to the purchase date.But I am already paying for exposure events in my regular plan. Am I getting double-charged?
If you buy the Experimentation offering, we waive the charge for exposure events in your regular Mixpanel plan. You only get charged for the exposure events via the MEU calculation.How can I monitor my account’s MEU consumption?
You can see your experiment MEU usage by going to Organization settings > Plan Details & Billing.References
Experiment Model Types
- Sequential: Allows you to detect lift and conclude experiments quickly, but may fail to reach significance for very small lifts. When to use? For large changes (~10%+ lift) when you want to stop early once significance is reached.
- Frequentist: Capable of detecting smaller lifts, but requires you to keep experiments for the full duration. You’re discouraged from preemptively making decisions before the test duration is complete. When to use? For very small changes (~1% lift) when precision matters.
Experiment metric types
- Primary Metrics: Main goals you’re trying to improve. These are metrics used to determine if the experiment succeeded. Examples: revenue, conversion rates, ARPU.
- Guardrail Metrics: These are other important metrics that you want to ensure haven’t been negatively affected while focusing on the primary metrics. Examples: CSAT, churn rate.
- Secondary Metrics: These provide a deeper understanding of how users are interacting with your changes, i.e, help to understand the “why” behind changes in the primary metric. Examples: time spent, number of pages visited, or specific user actions.
Make Your Decision
Once the experiment is ready to review, you can choose to ‘End Analysis’. Use these guidelines to make informed decisions:When to Ship a Variant
- Statistical significance achieved AND practical significance met (lift meets your minimum threshold)
- Guardrail metrics remain stable (no significant negative impacts)
- Sample size is adequate for your confidence requirements
- Results align with your hypothesis and business objectives
When to Ship None
- No statistical significance achieved after adequate test duration
- Statistically significant but practically insignificant (lift too small to matter)
- Negative impact on guardrail metrics outweighs primary metric gains
- Results contradict your hypothesis significantly
When to Rerun or Iterate
- Inconclusive results due to insufficient sample size
- Mixed signals across different user segments
- External factors contaminated the test period
- Technical issues affected data collection
What to Watch Post-Rollout
- Monitor guardrail metrics for 2-4 weeks after full rollout
- Track long-term effects beyond your experiment window
- Watch for novelty effects that may wear off
- Document learnings for future experiments
Decision Options in Mixpanel
- Ship Variant (any of the variants): You had a statistically significant result. You have made a decision to ship a variant to all users. NOTE: Shipping variant here is just a log; it does not actually trigger rolling out the feature flag unless you are using Mixpanel feature flags (in beta today).
- Ship None: You may not have had any statistically significant results, or even if you have statistically significant results, the lift is not sufficient to warrant a change in user experience. You decide not to ship the change.
- Defer Decision: You may have a direction you want to go, but need to sync with other stakeholders before confirming the decision. This is an example where you might defer a decision and come back at a later date and log the final decision.
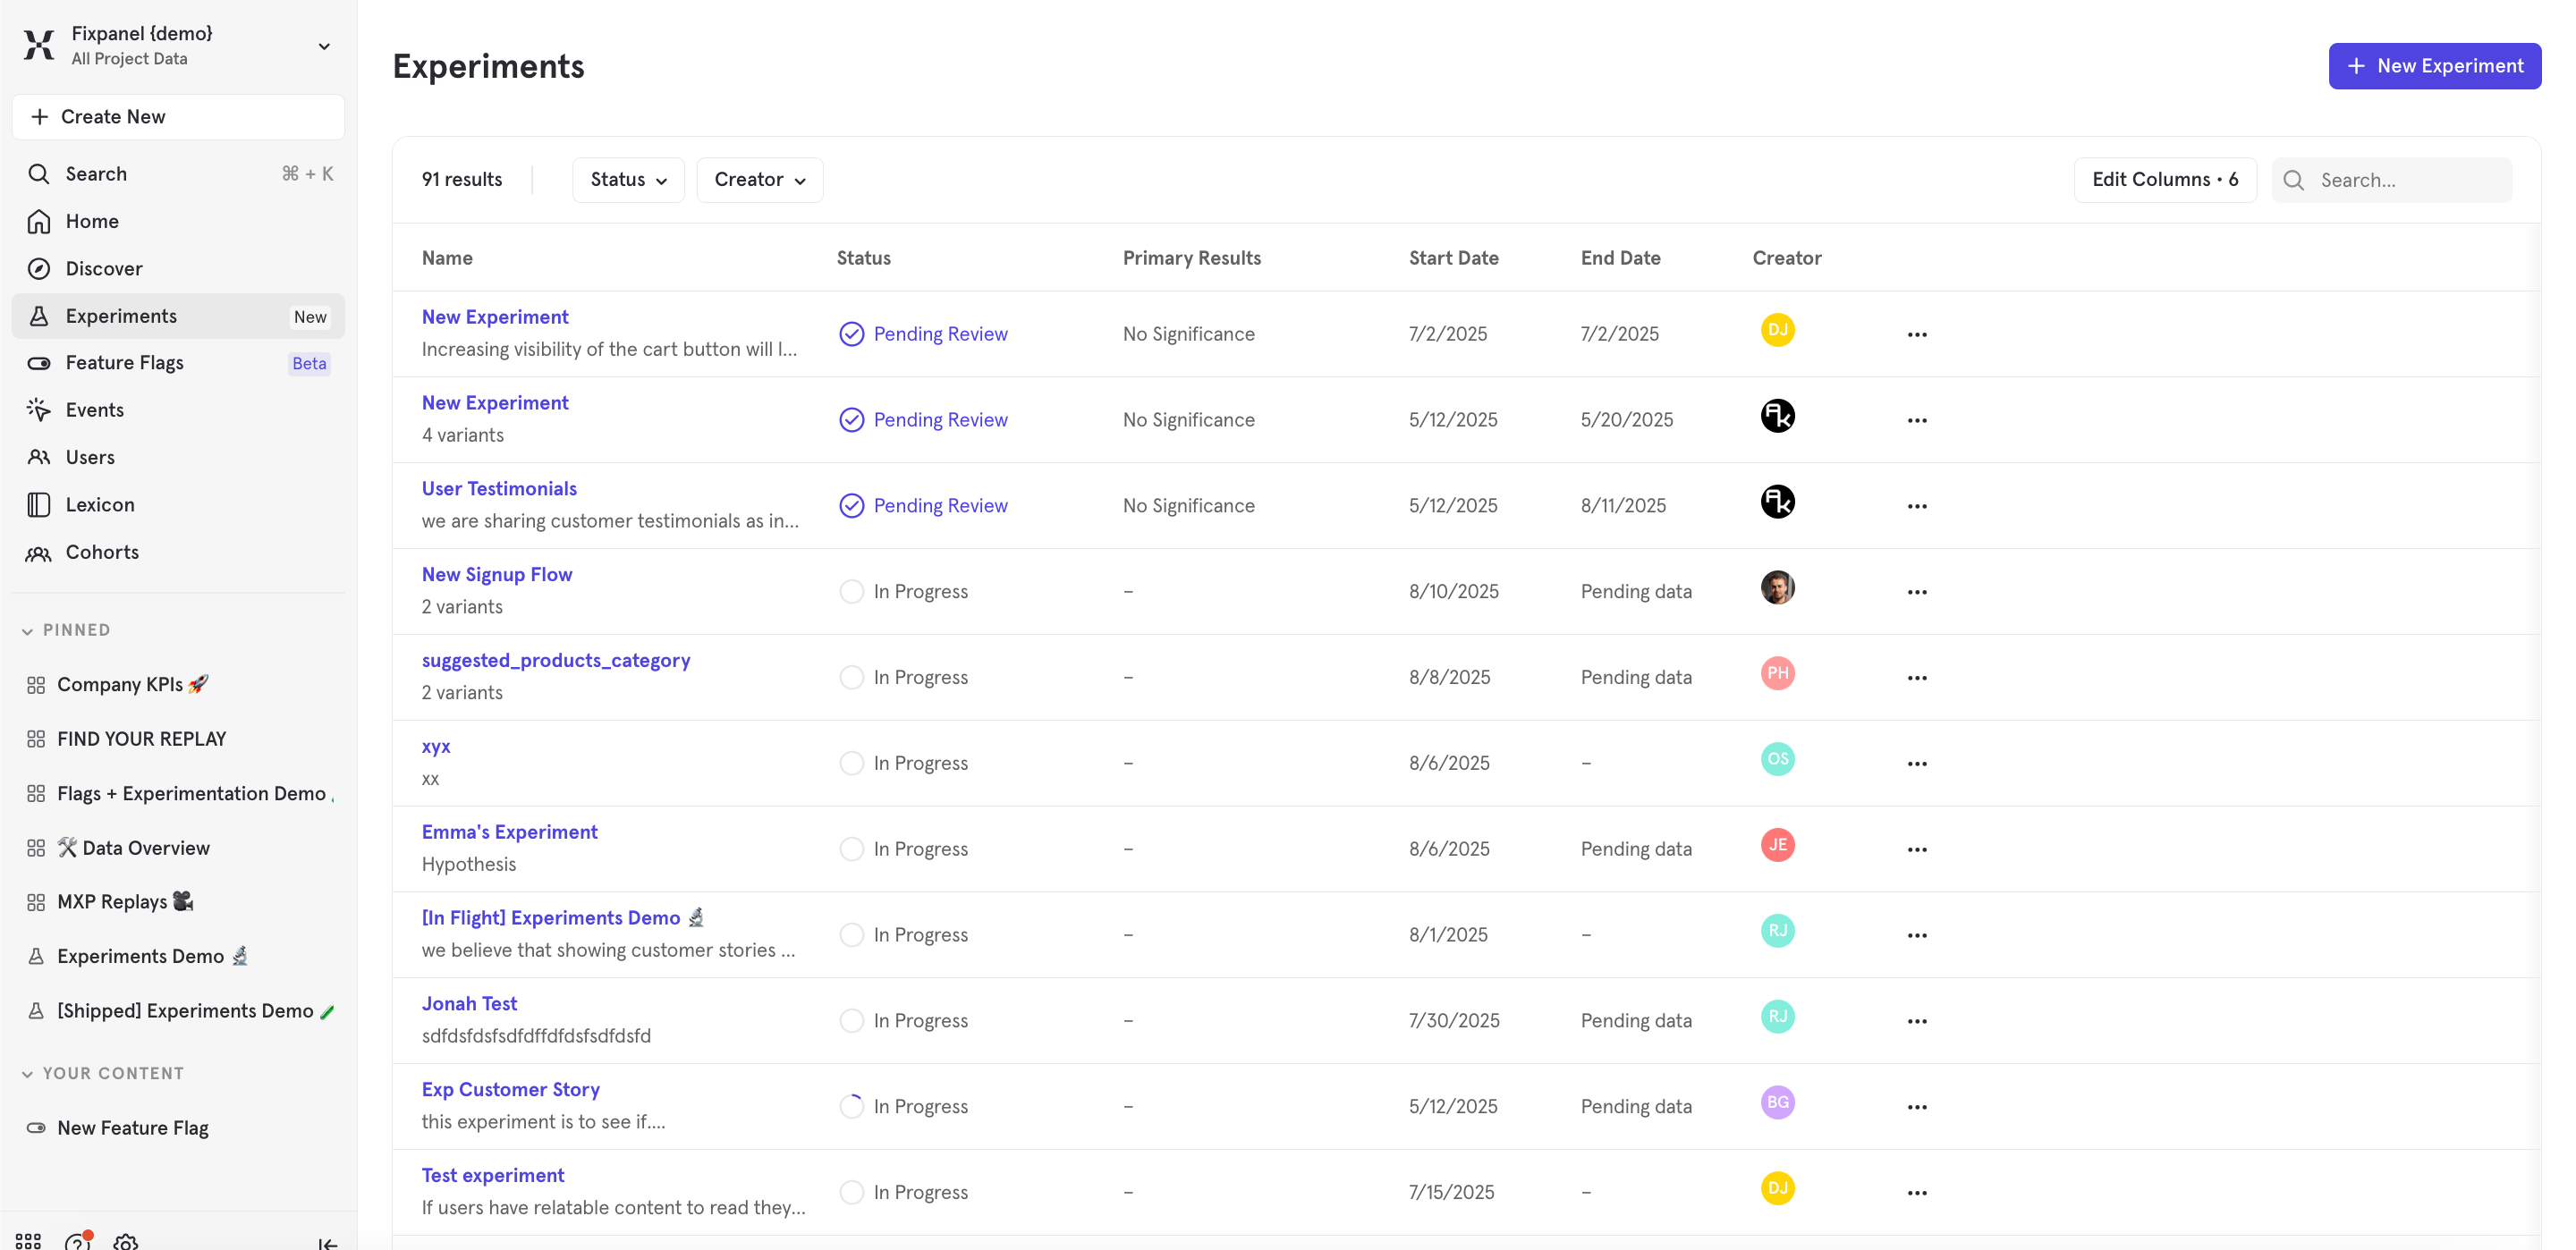
Experiment Management
You can manage all your experiments via the Experiments Home tab. You can customize which columns you’d like to see.