Overview
This page covers advanced concepts related to funnels, including how their metrics are measured and their various configurations.Conversion Criteria
Conversion Window
The Conversion Window determines how much time a user has to convert through all steps of the funnel after entering it. By default, all customers have 7 days to complete a funnel from the timestamp they perform the Step 1 event. To adjust this conversion window, click on the words 7 days in the conversion criteria. You will be able to adjust both the unit of time and the amount.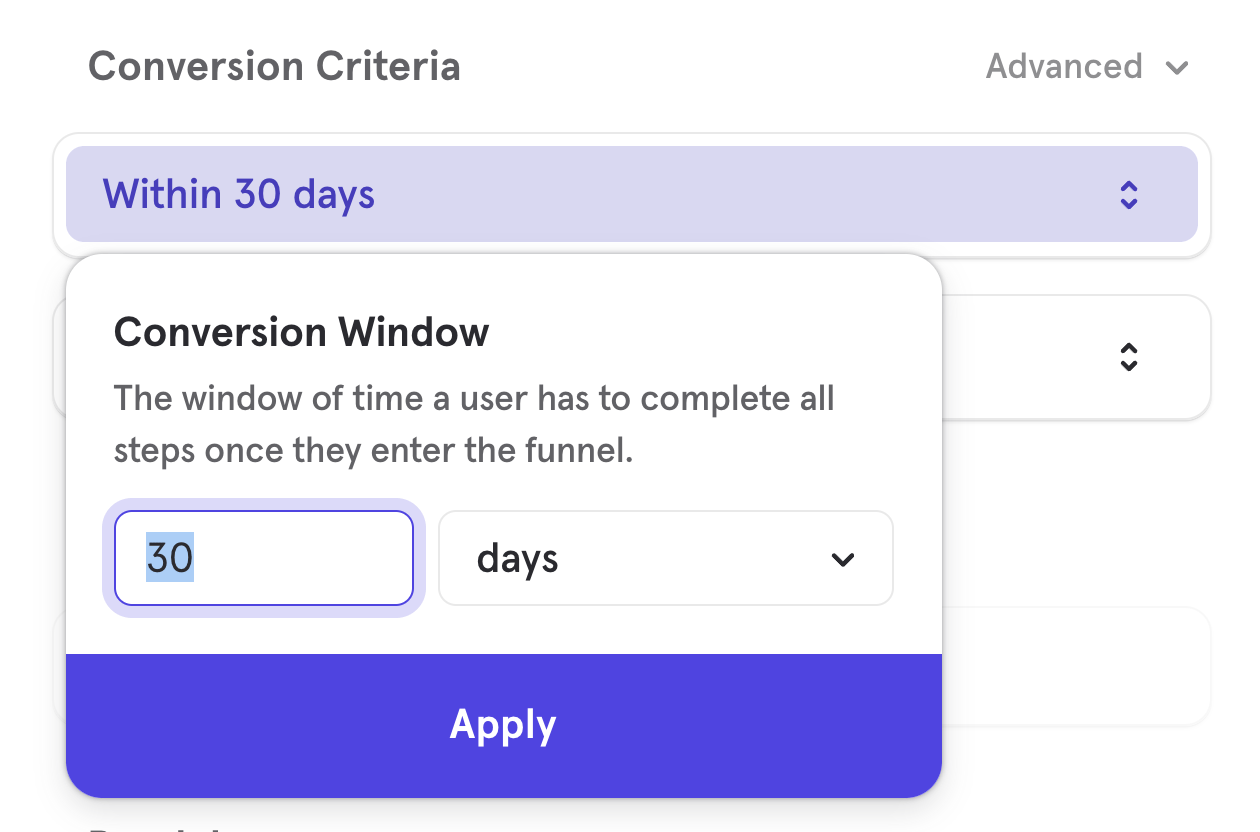
- Event A at 1:00 pm
- Event A at 1:30 pm
- Event B at 1:45 pm
- Event C at 2:15 pm
Optimized Re-entry
When Optimized Re-entry mode is enabled, we actively evaluate all funnel entry attempts - even if the user’s previous funnel is still in progress. This allows us to capture potential conversions that might occur from subsequent entries, maximizing total conversions. If any user funnel entries within the report date range result in a conversion, we count the user as converted.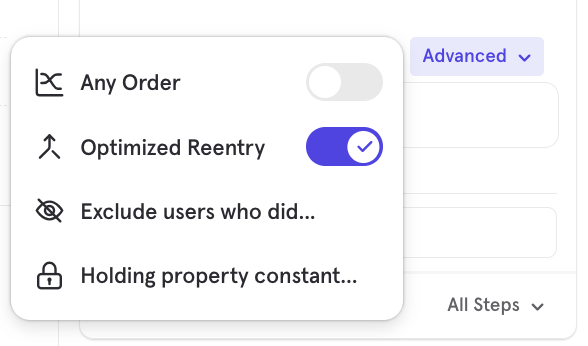
- Funnel Steps: A -> B
- Event Stream: A -> Conversion Window Ends for A Ends -> A^ -> B
- Funnel: A -> B
- Event Stream: A -> A^ -> Conversion Window for A Ends -> B
- For Unique aggregation during a date range with multiple funnel conversions, we consider the first converted funnel only. For example, in scenario A → B → A^ → B^, there are 2 user funnels converted: A → B and A^ → B^. We only consider the first A → B as the user conversion.
- In a multi-step funnel, we only consider the first step for re-entries. For every subsequent step, we pick the first instance of the step.
- For the first step in a funnel, if there are multiple entries prior to step 2, we consider the most recent entry. For example, in scenario A → A^ → A^^ → B, where all actions happen within the conversion window, A^^ → B would be recorded as the funnel.
- For all other counting types - TTC, Property Sum - we compute these based on the funnels selected to optimize maximum conversions. For example, in scenario A → A^ → A^^ → B, where all actions happen within the conversion window, in the Optimized Reentry mode, TTC would be calculated for A^^ → B. However, in the Default mode, TTC would be calculated for A → B.
Ordering
The order control determines how much flexibility there can be in the sequence of your user’s actions to be counted as a conversion. By default, funnels are based on a specific order.Specific Order
Specific Order Funnels require the user to complete each of the funnel steps in the order laid out to be counted as a conversion from one step to another. In other words, Step 1 must be completed before Step 2, which must be completed before Step 3, and so on. The user can engage in other actions in between funnel steps - including additional occurrences of the actions listed as funnel steps - but they will only be counted as converted if they complete all the funnel steps in order. To illustrate with an example, let’s say a specific order funnel has steps: A → B → C → D → E- The user does events A → B → C → D → E in exact order. Mixpanel counts this as a conversion.
- The user does event A → B → F → C → D → E. Mixpanel counts this as a conversion. Users can do additional actions in between funnel steps and still convert.
- The user does events A → B → D → C → D → E. Mixpanel counts this as a conversion. Even though the user did D before the first time they did C, they will continue to convert because they eventually did a D after C.
- The user does events A → B → C → E. Mixpanel will not count this as a full conversion, and the customer will drop off after step C. The customer’s completion of step E is excluded from the funnel because step D did not occur.
Any Order
In Any Order Funnels, users can complete unanchored funnel steps in any particular sequence and still convert. This type of funnel is most useful in situations where a user must complete all actions to be considered converted, but the exact order is not important. A good example of this could be a job application flow, where a user must input multiple pieces of information (their name, email address, current job title, etc.) to complete the form and submit their application, but they can provide all the information in any order. To switch to Any Order, expand the “Advanced” menu in the Conversion Criteria and toggle on “Any Order”. When you switch to Any Order, you have the option to anchor specific steps in your funnel by clicking on the step number. A step will either appear with a number beside it, indicating where it must fall in the funnel, or with an asterisk (*), indicating that it can be performed in any order before the next anchored step. If you have selected any order for your funnel steps, you have the option to select Top paths from the drop-down visualization list to view a Sankey visualization of how your users are performing the steps in your funnel.
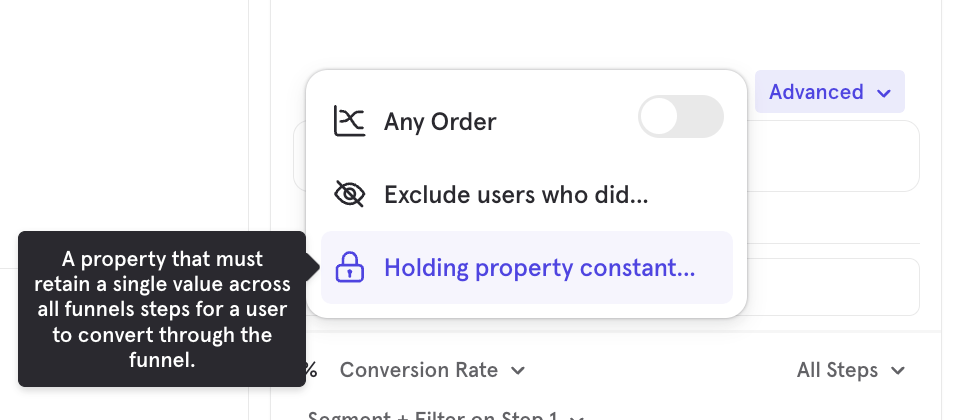
Hold Property Constant
Holding a property constant in a funnel requires that a user retain the same value for a given event property for each step to convert. In other words, a user must perform the funnel events in the order you specified with the same property value. For example, let’s say your product is an e-commerce retail site, and you have a three-step funnel of Browse → Add to Cart → Purchase. If you want to examine the conversion of users through this funnel who browse, add to cart, and purchase the same item - meaning that they cannot convert if they do not complete each step with the same item - you would hold the Item Name property constant. Since all the events must have the property, you can only select event properties that apply to all of the events in your funnel. You can select multiple properties, but when you do, all of them must be kept constant. A maximum of 3 properties can be held constant at the same time. The way entry values are determined when “Holding Property Constant” depends on the selected counting method:- Uniques: With the “Uniques” counting method, users will only enter the funnel once, the first time they do Step 1. Mixpanel will hold the property value constant from the first Step 1 event.
- Totals or Sessions: “Totals” and “Sessions” counting methods allow users to re-enter the funnel. Mixpanel will hold the property constant that is set with each new re-entry at the Step 1 event. This means the user can enter multiple times with different property values.
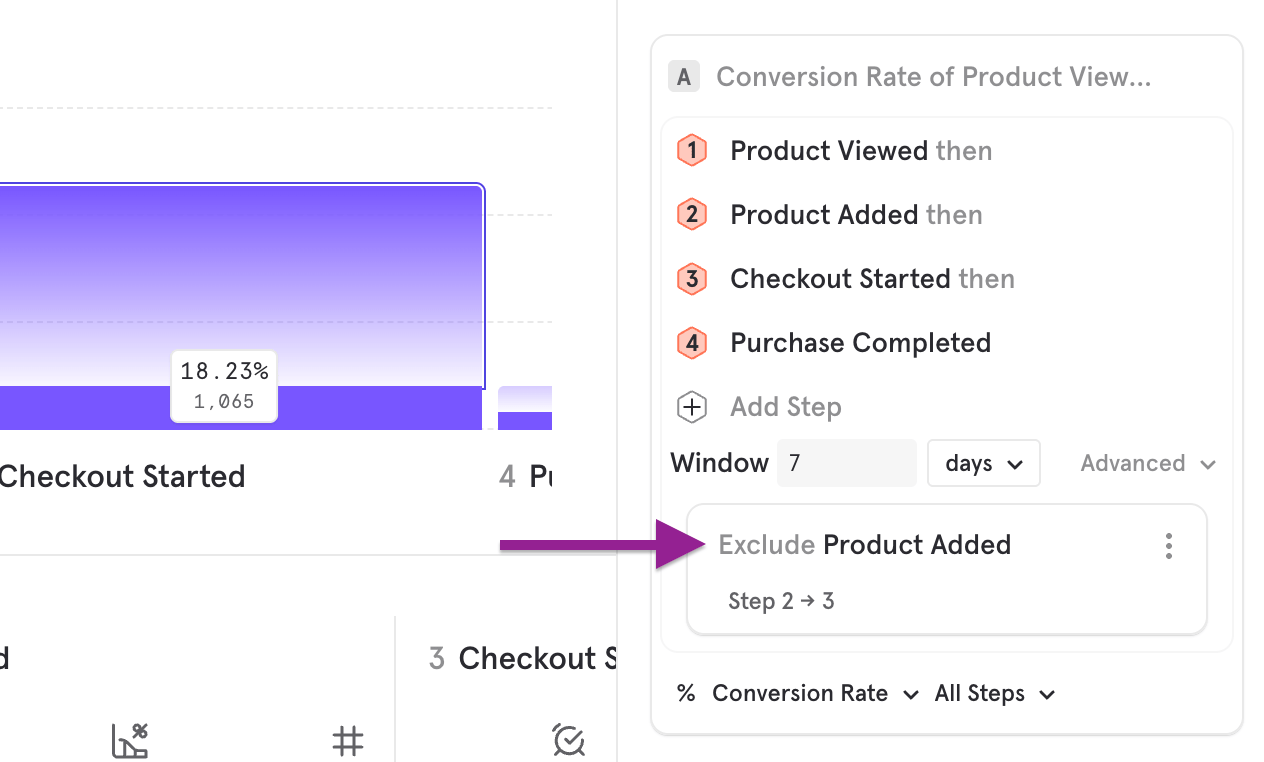
Exclusion Steps (Exclude users who did…)
Exclusion steps operate as a “did not do” filter for funnels. This provides the ability to create a funnel where users are excluded from converting if they track a specific event between the funnel steps. A few things to note about exclusion steps:- An exclusion step can be placed between any steps in the funnel. It cannot be the first or last step. Example scenario: The user tracks (1) Event A → (2) Event A → (3) Event A → (4) Event B Totals conversion funnel looking at A → B, with Exclusion Step: Event A The user enters the funnel when they track (1). They then drop off when they track (2) since Event A is excluded. With the totals conversion criteria, the user will re-enter the funnel at (3) and then convert with (4). Overall, there will be two entries and one conversion. Example reports for reference from our demo dataset:
- A user will qualify for each step in the funnel until they track the exclusion step. This means users who tracked the exclusion step are still able to enter the funnel and convert through the steps. Use a cohort filter if you want users who did a particular event at any point to be excluded from entering the funnel.
- There may be any number of exclusion events between steps.
- Exclusion steps have the same two-second grace period as other steps in the funnel.
Saved Funnel Behaviors
You can save the Funnel Behavior you built and reuse it in other reports. This can be helpful when there is a sequence of events that you frequently analyze (such as sign-up flow), or if you want to analyze your Funnels Behavior alongside other metrics in an Insights report. Select the ”…” button in the top right corner of the metric, then click “Save Behavior”. Note that saving a behavior and saving a metric are different; a saved behavior consists of the events/Funnels/Retention, while a saved metric consists of the saved behavior and the measurements of the behavior.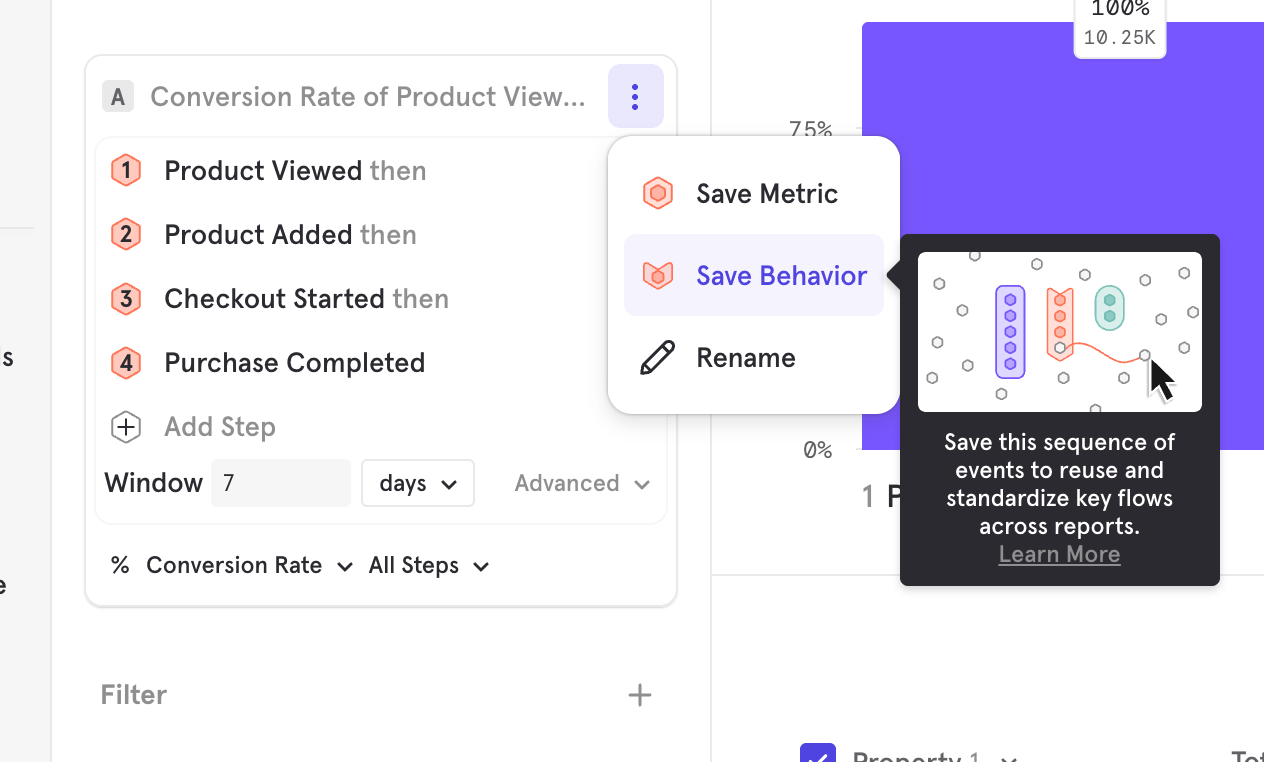
Counting Methods and Measurements
You have a variety of options to measure your funnel behavior.Counting Methods
Measurements
Step Selection
You can select which step of the funnel you would like to measure. By default, this is set to All Steps. To change your step selection, press “All Steps” and choose the desired range. When measuring “Unique Users”, “Total Conversions”, or “Total Sessions”, you can select “Entering Funnel” in order to get a top-of-funnel count. Similarly, if you would like to get the bottom-of-funnel count, you can choose “All Steps”.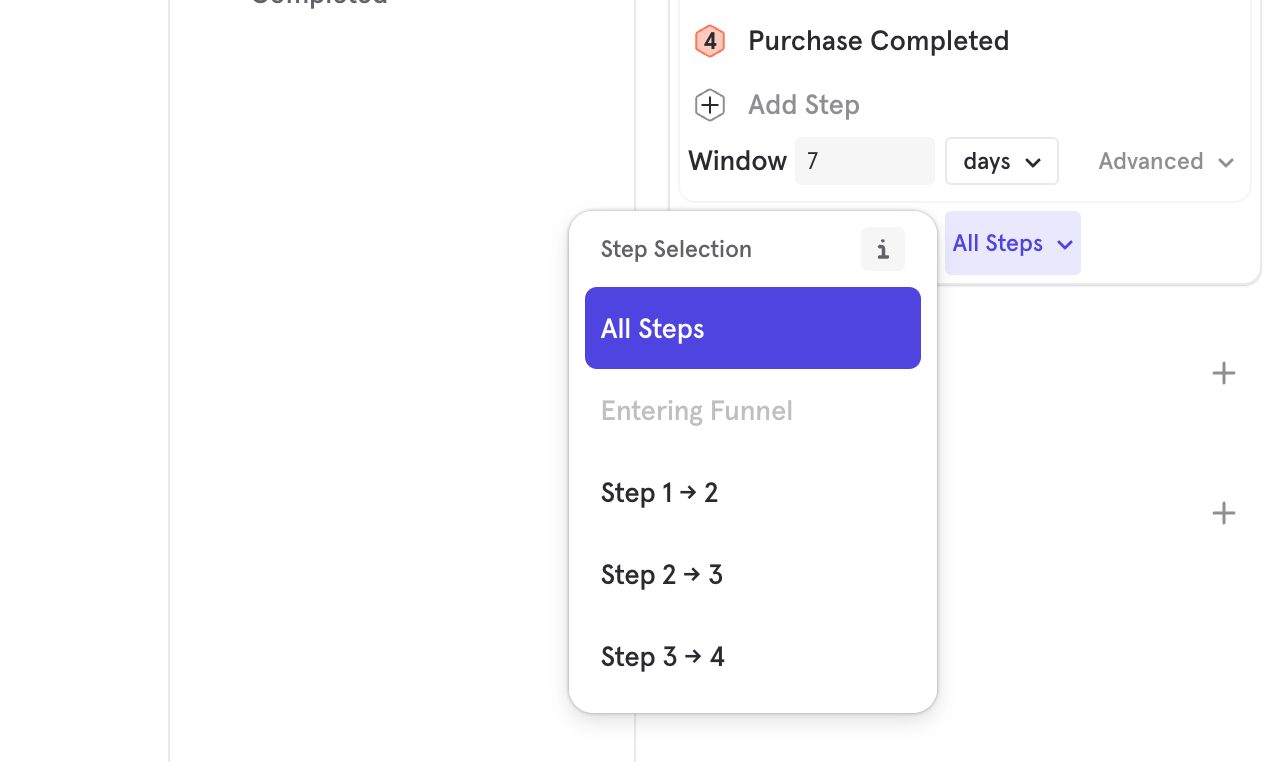
Time to Convert
Time to Convert is a feature within the Funnels report that measures how long it takes users to move through the steps of a funnel, from the first event to the last (or between any two specific steps).Time to Convert Measurement
You can select a Time to Convert aggregation to see how quickly or slowly your funnel converts. You can see this as a summarized value by selecting “Metric” or “Bar” visualizations, or you can see it as a trend using the “Line” visualization. You can also see the time to convert for a particular chosen step selection. (Note: Our percentiles are calculated using an approximate algorithm, and when this algorithm is run on small/sparse datasets, the results can be non-deterministic, i.e., the results can differ by a small amount across runs.)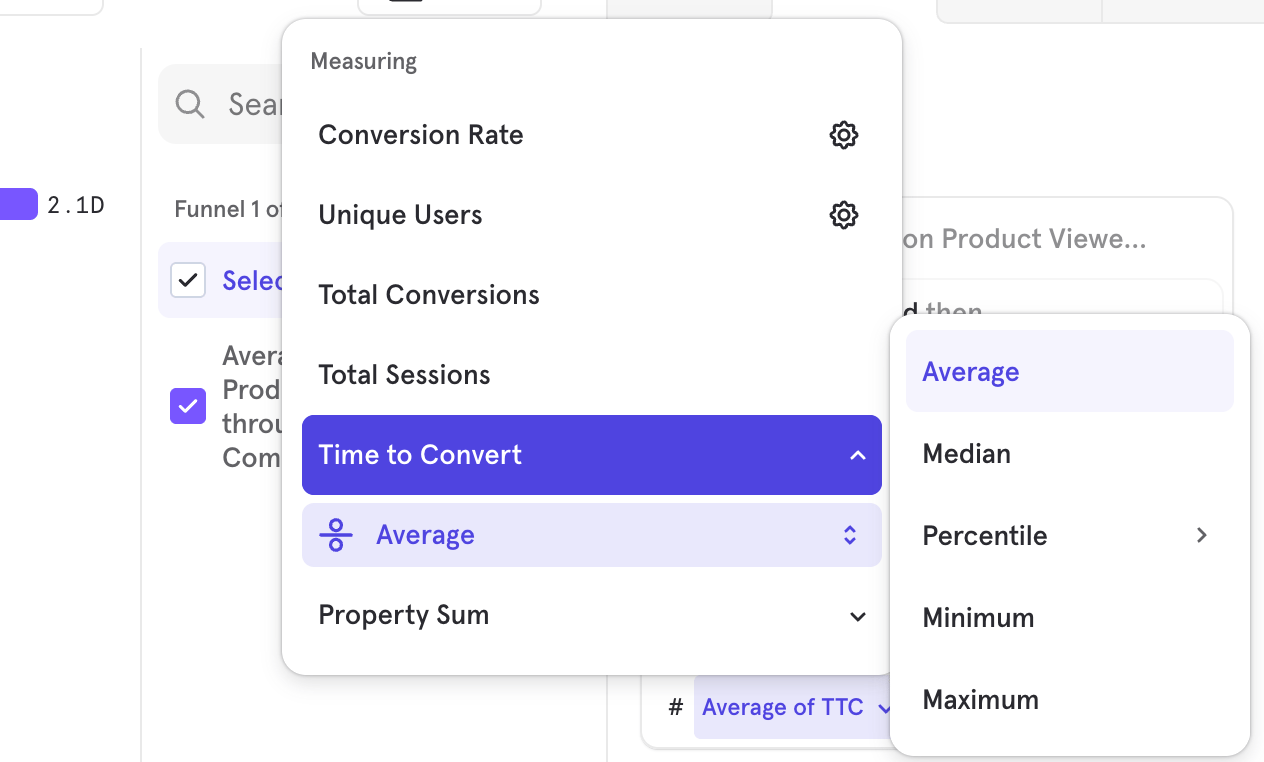
Time to Convert Breakdown
You can select the Time to Convert breakdown to see a distribution of the time users took across the funnel or between any two steps. The steps selected in the breakdown are independent of the step of the metric you are measuring. For example, you can measure the overall conversion rate broken down by Time to Convert between Steps 1 and 2. Time to Convert works like any other property in that you can filter to a specific range of times or customize the bucketing of the breakdown. You can’t use it as an inline filter since it is used to filter funnels, which have been measured, rather than changing the per-step conversion window. You can see a distribution of the conversion time to convert by using the ‘Time to Convert’ breakdown in combination with measuring total conversion. You can also use this to see how other metrics, such as conversion rate, are affected based on how quickly users convert on a particular step range.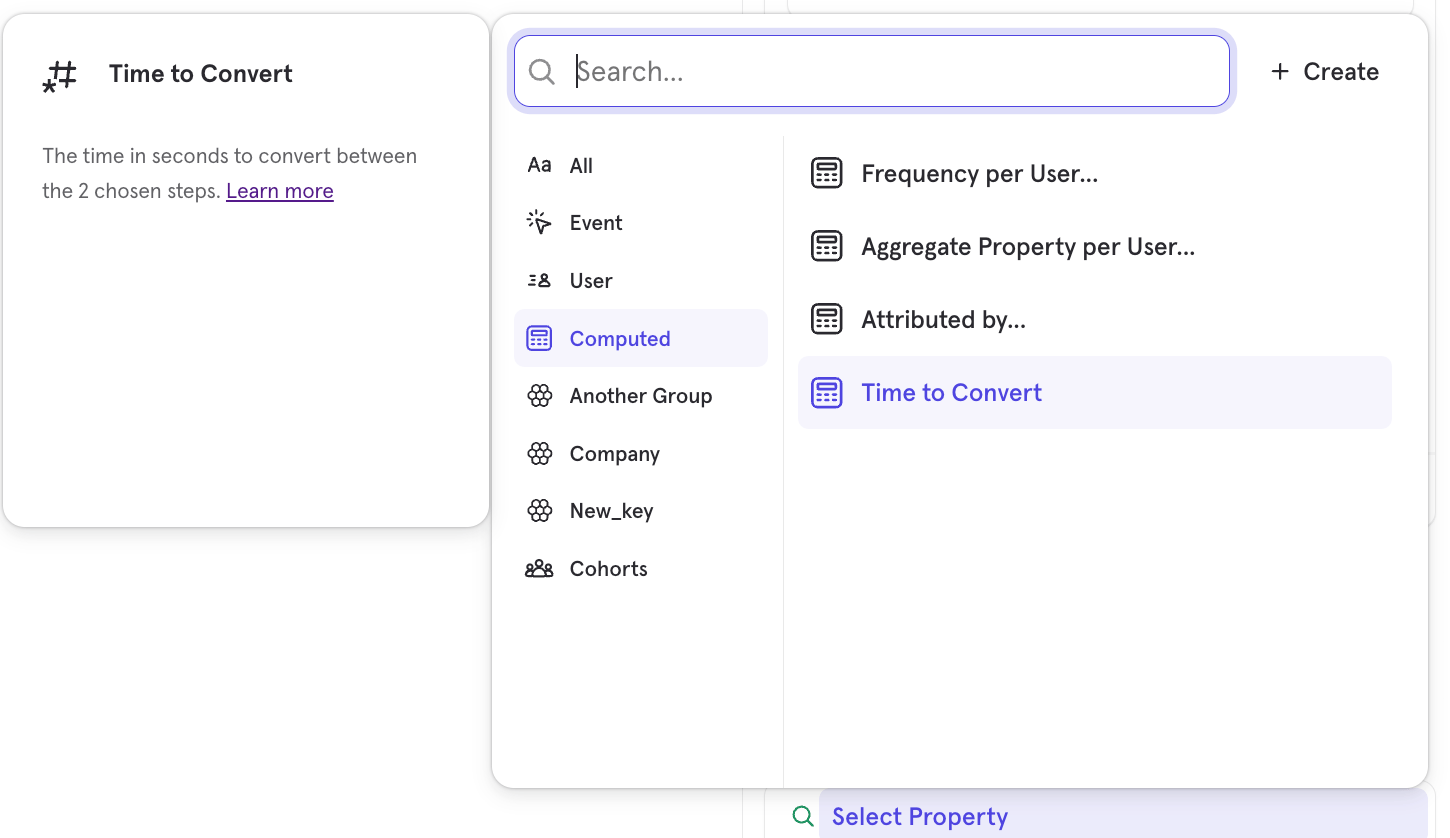
Property Sum
This measurement type allows you to visualize a numeric event property through a funnel. Instead of seeing how many users move through your flow, you can select an event property that exists on each step of the funnel. Mixpanel will sum up the total value of this property at each stage of the funnel and visualize the total amount converted, or the drop-off at each step if “Funnel Steps” visualization is selected. For example, this could be used to visualize the revenue across the funnel steps. Note: For many e-commerce flows, you will want to pair the property sum with hold property constant on item ID so you can track each individual item. To use this property, select Property Sum from the measurement menu and select a numeric property.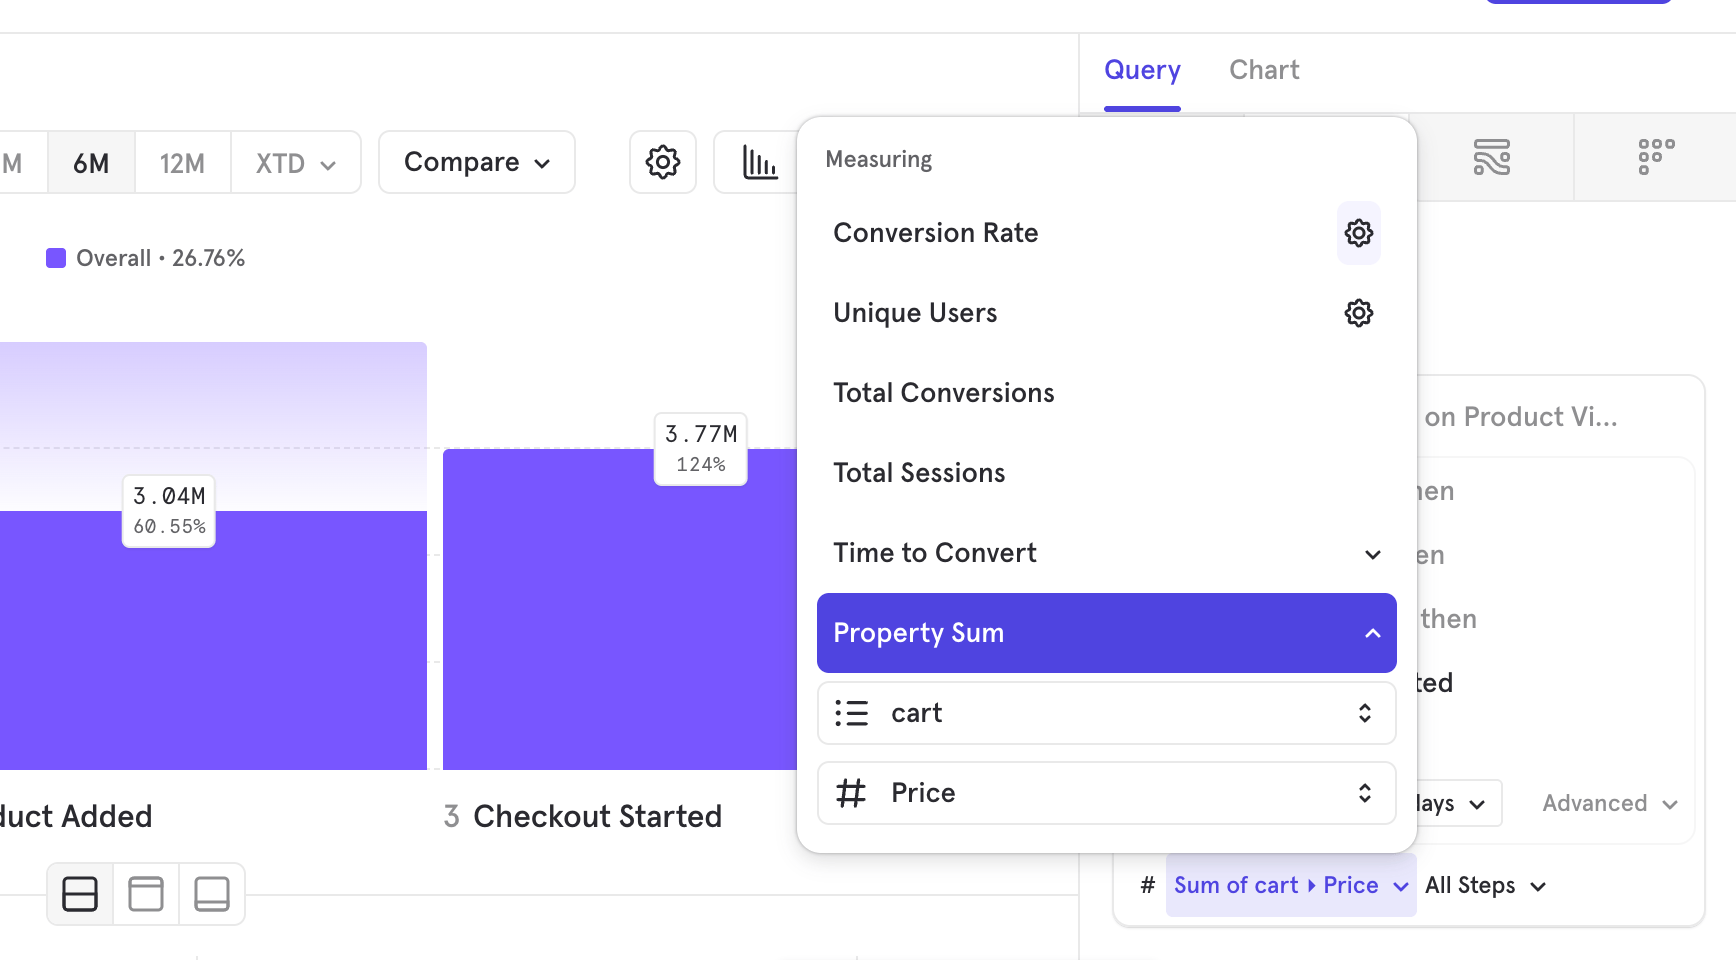
Behavioral Properties
Behavioral properties allow you to use your user’s activity and use it as a property in your other analysis. Behavioral properties work like any other numeric property in that you can filter to a specific range of frequencies or customize how it is bucketed. In funnels, the behavioral property is computed in the time range between 2 steps in your funnel. You can specify which steps in the funnel this applies to. The step selection is separate from the overall funnel measurement; for example, you can measure the overall conversion rate but break it down by the frequency of an event between Steps 1 and 2. The behavioral properties will only count the events in the chosen range. The event that originally satisfied the funnel definition does not count towards the behavioral property between steps. For example, if a user performs “Step 1 → Step 2”:- Frequency: “0 times” — there is no extra “Step 1” event, so the frequency will be “0 times”
- Frequency: “1 time” — we will count the second “Step 1” event, so the frequency will be “1 time”
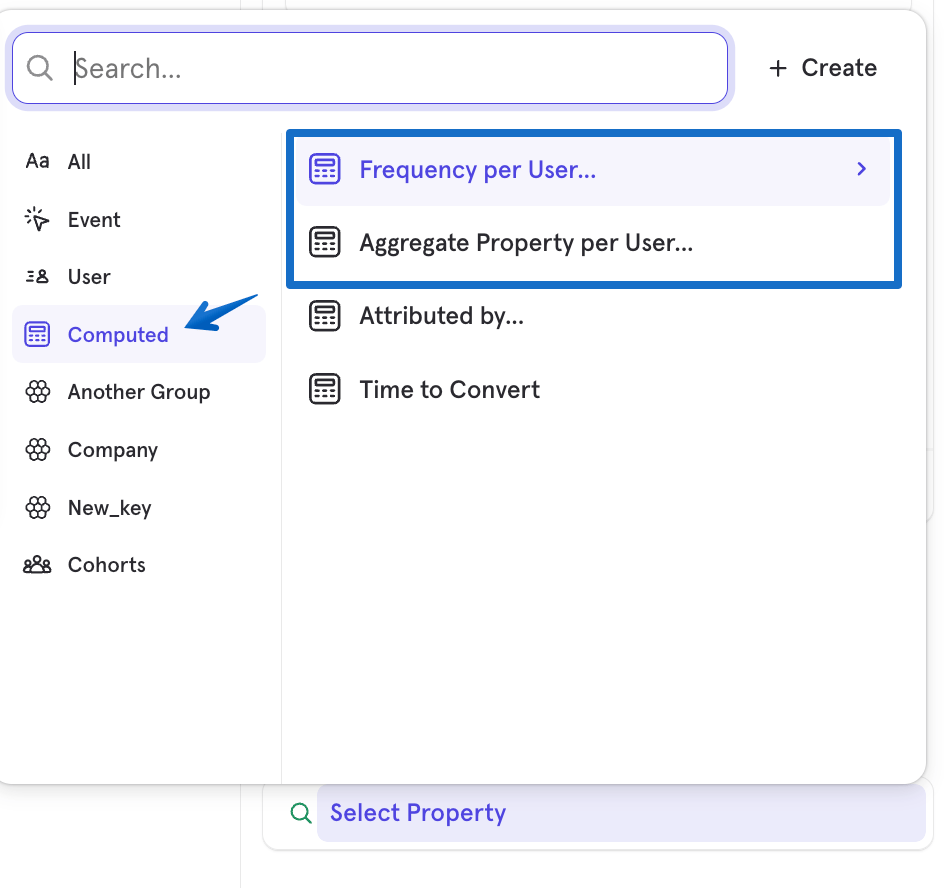
Frequency per User
Use the Frequency per User to see the number of times users performed an event between any two funnel steps. For example, see the number of times a user listened to a song between signing up and purchasing the song.Aggregate Property per User
Use ‘Aggregate Property per User’ to see the aggregation on an event property between steps. For example, you can see the sum of a purchase amount between steps.”Attributed by…” Breakdown
You can select this breakdown to attribute credit for the funnel to touchpoints along the user journey. The attribution is calculated on the first step of the funnel. See the Attribution doc for more information.Comparison Events
You can select multiple events at a particular step in a funnel, and Mixpanel will compute a segmented funnel that shows what percent of users reached each of these comparison events. To do this, click on the ”…” menu and select “Event Comparison”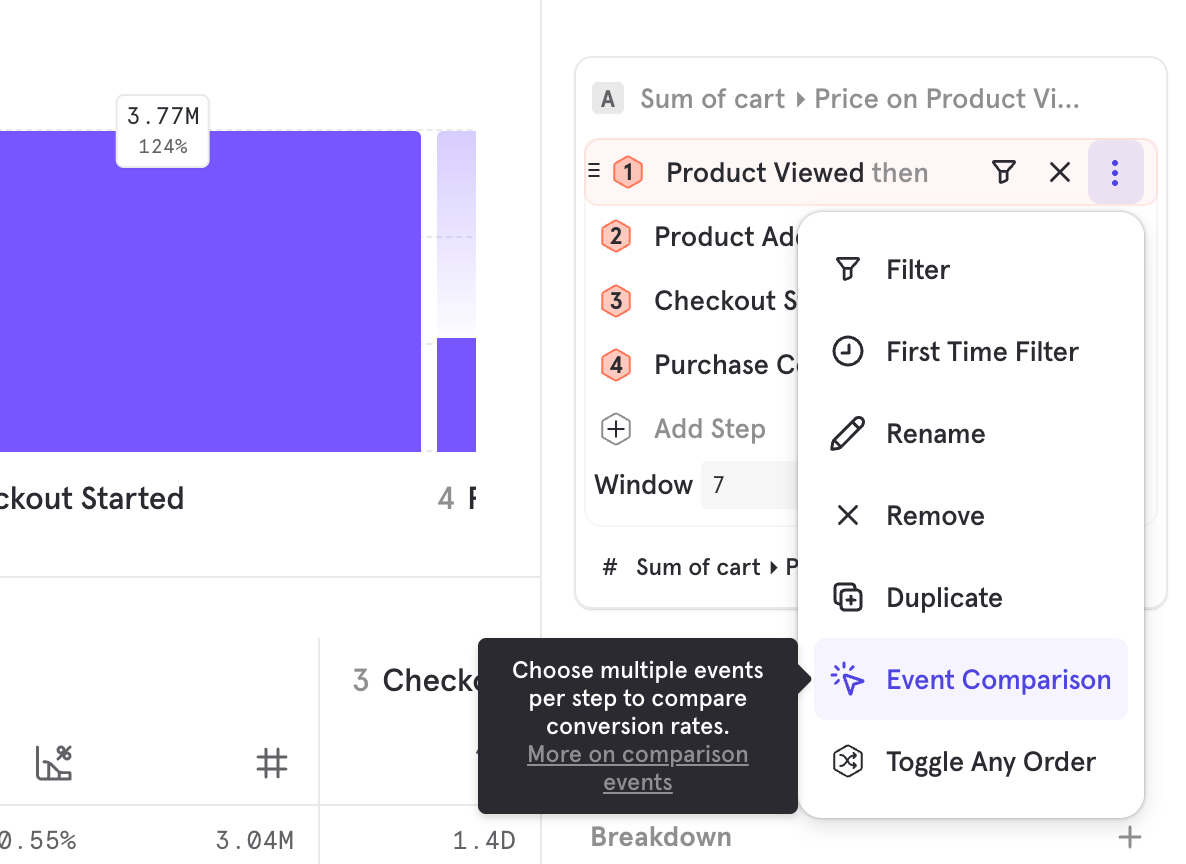
Breakdowns
User Count in Breakdown
Users will count in each breakdown segment in which they qualify. In order to qualify for a new segment, the user must have exited their previous funnel attempt unless the funnel is holding a property constant. The breakdown segment value is determined by the selected property attribution. For example, let’s say a user tracks the following:- Browse Product, item = shirt
- Browse Product, item = jeans
- Add to Cart
- Browse Product, item = shoes
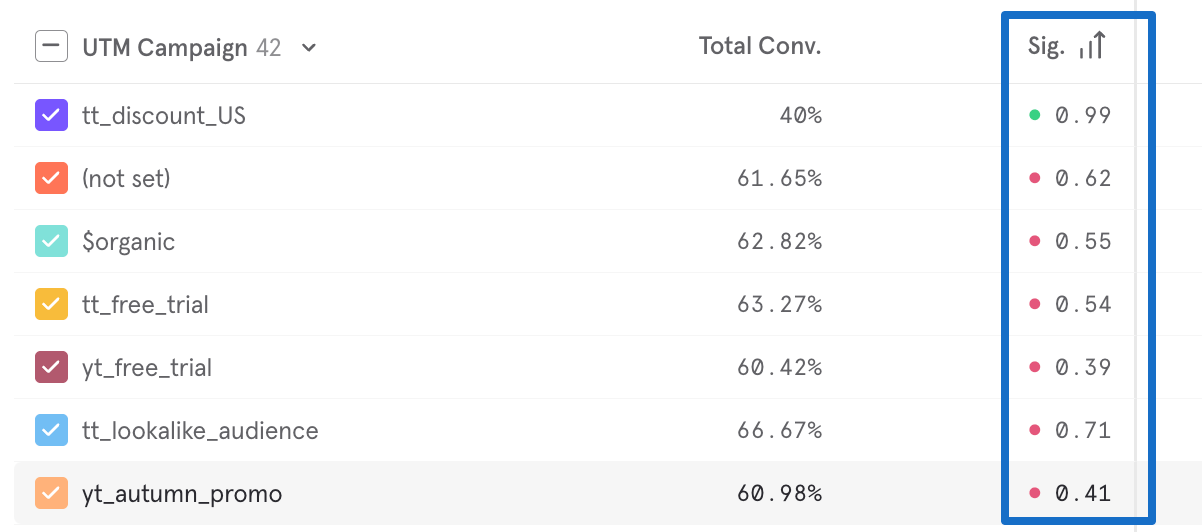
Significance
Statistical significance in funnels validates an increase or decrease in conversion rate for a property or cohort segment. It attempts to identify random chance with respect to overall conversion. A p-value indicating statistical significance is calculated in the overview table when you choose a property or cohort to group by. In statistical hypothesis testing, the p-value or probability value is the probability that the variation in a segment’s conversion rate, compared to the overall conversion rate, is not driven by random chance. This value is shown for every segment by default. To learn more about how this is calculated, click here. In order to clarify this statistical significance, the segmentation chart shows the confidence level of each segment. Confidence level is defined as 1 - p.- > 0.95 = statistically significant, indicated in green. This variation in conversion rate is likely not driven by random chance.
- < 0.95 = not statistically significant, indicated in red. This variation in conversion rate is likely driven by random chance.
Filters
Inline Filtering (Pre-Query)
Inline filters allow you to apply event or user property filters to each step of your funnel. This adds granularity and specificity to your conversion criteria. In selecting an inline filter, you are tightening the parameters of events that qualify for conversion. Inline filters are performed pre-query. Thus, these filters will impact your funnel’s conversion by removing events that don’t qualify from consideration of being included in a funnel calculation.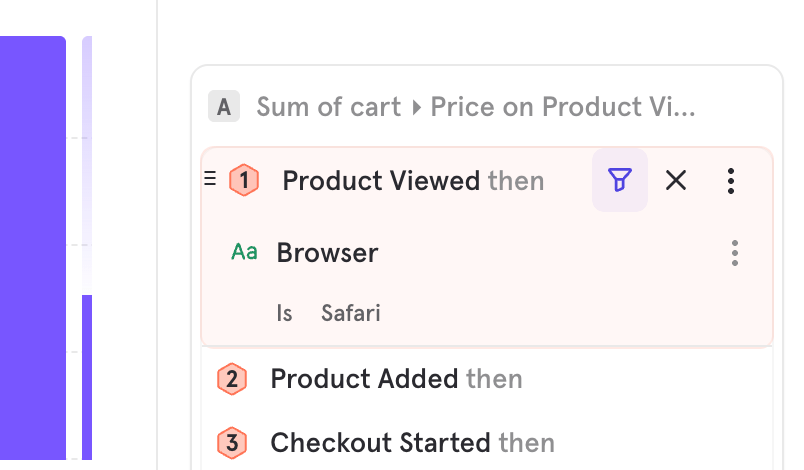
Global Filtering (Post-Query)
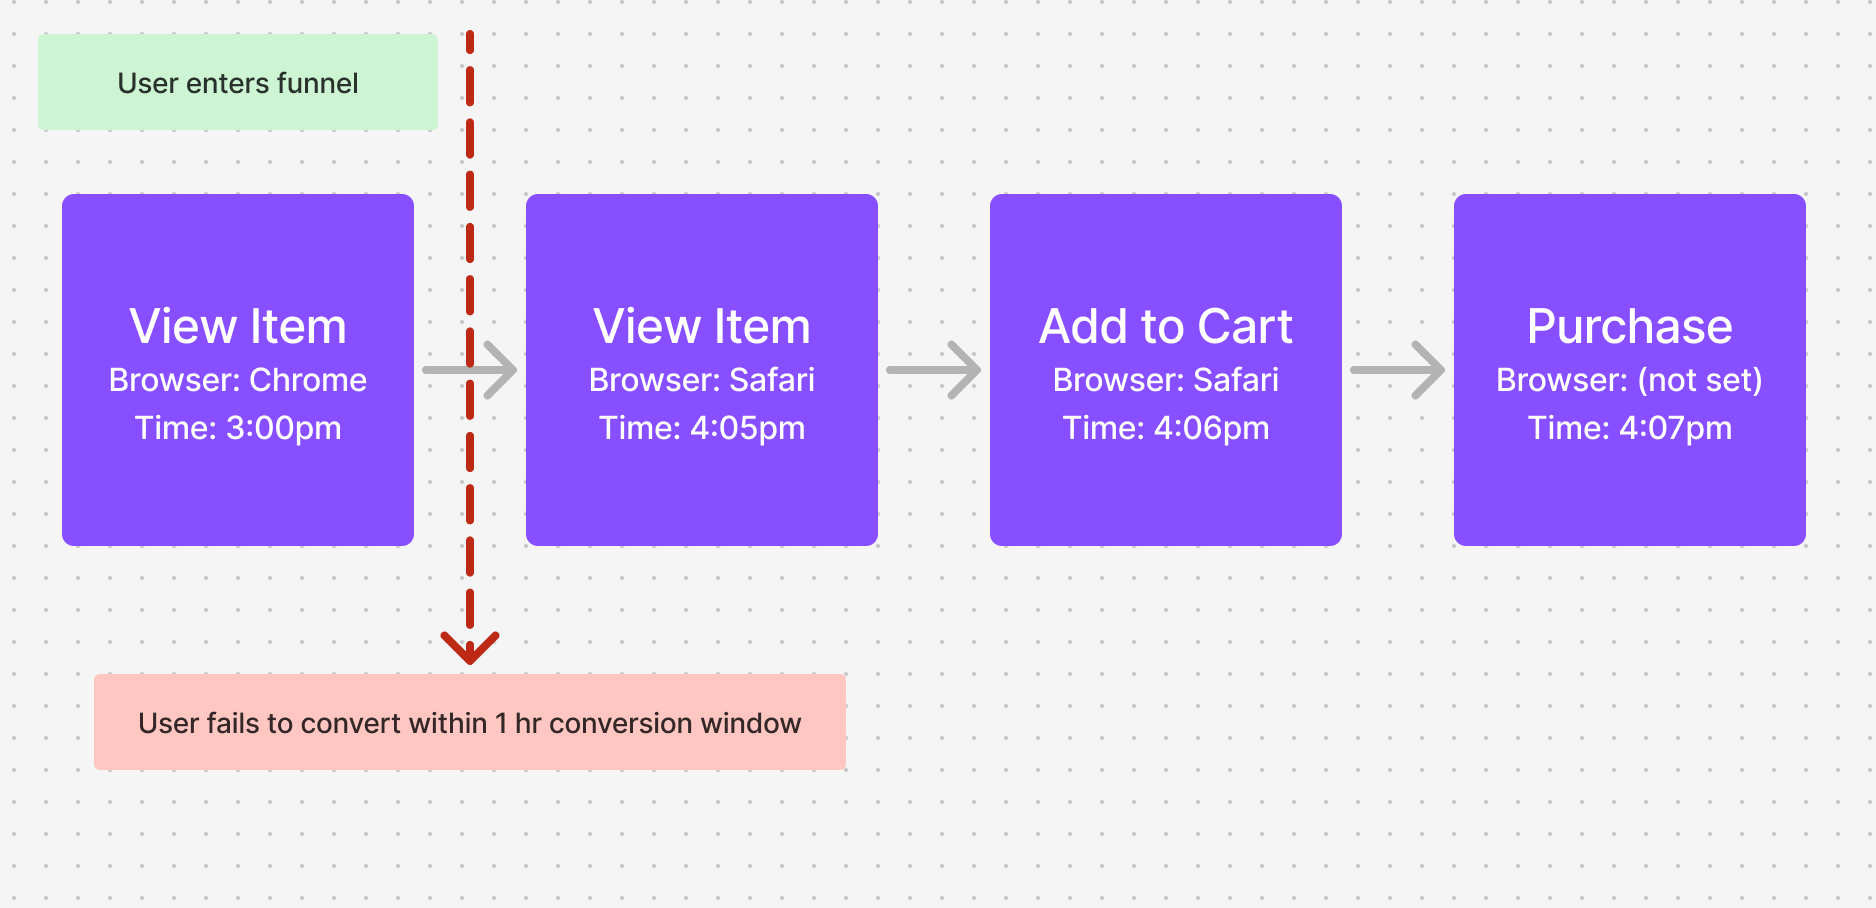
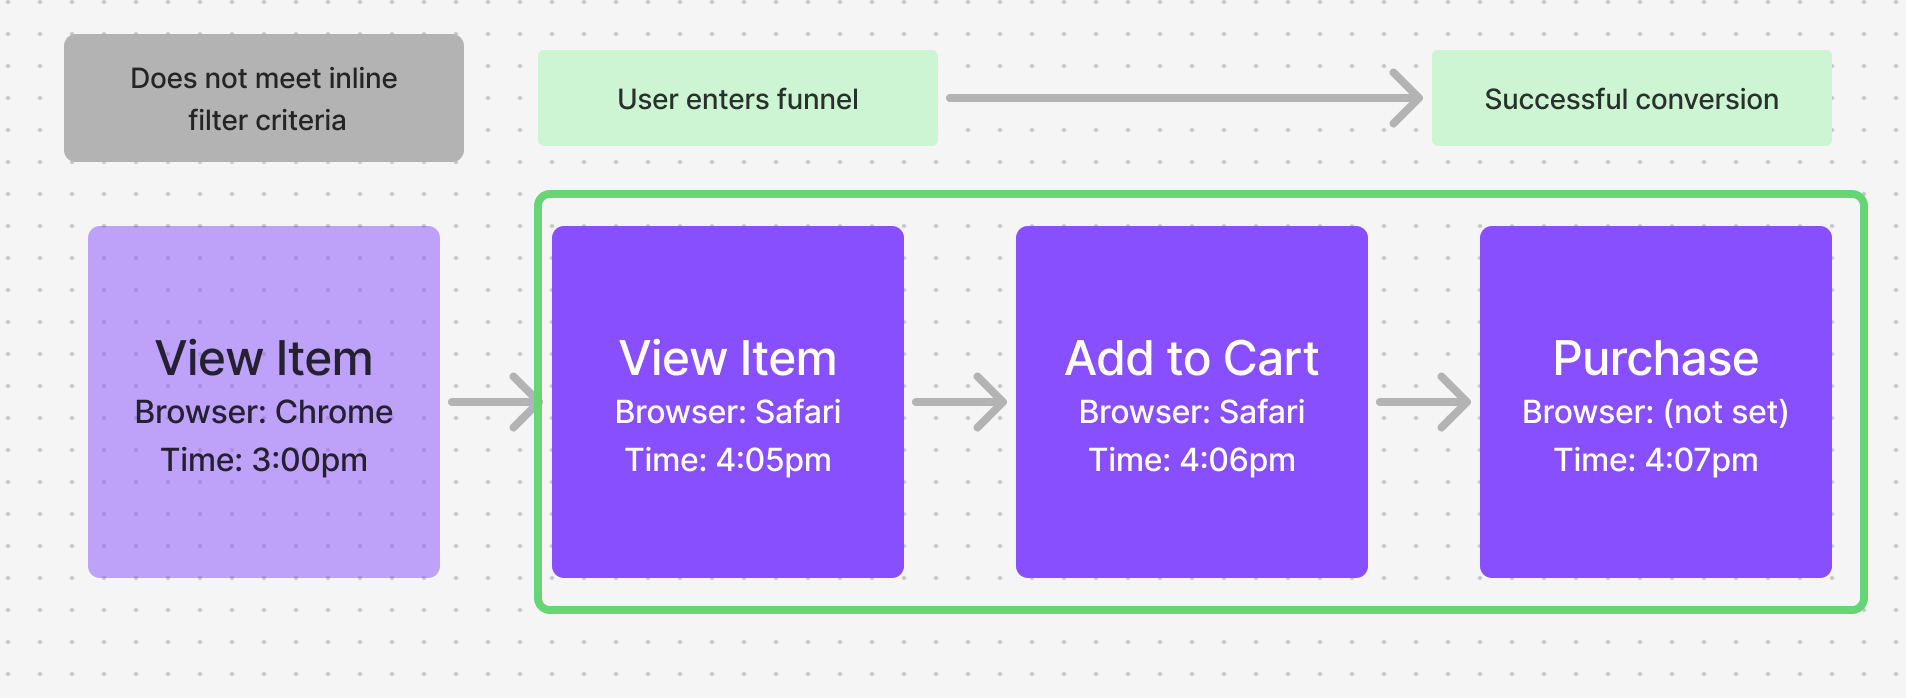
Global filters apply your selected filters to the entire report after the Funnels query has been run. Since Funnels will calculate conversions first and then apply your global filters, entire conversions that do not meet the filter requirements will be excluded from the report’s results. The filter value is determined based on the property attribution selected. For example, let’s use the same three-step funnel where a user must View Item → Add to Cart → Purchase, all within a one-hour conversion window. This time, we apply a global filter of “Browser = Safari”, filtering on “First Step Defined”. In the below example, the same user’s funnel entry would be their first “View Item” event, with a “Browser = Chrome” since this is the first defined property value. When the global filter is applied, the entire entry is filtered out since it doesn’t meet the filter criteria. This means the report would show no users entering the funnel at “View Item”.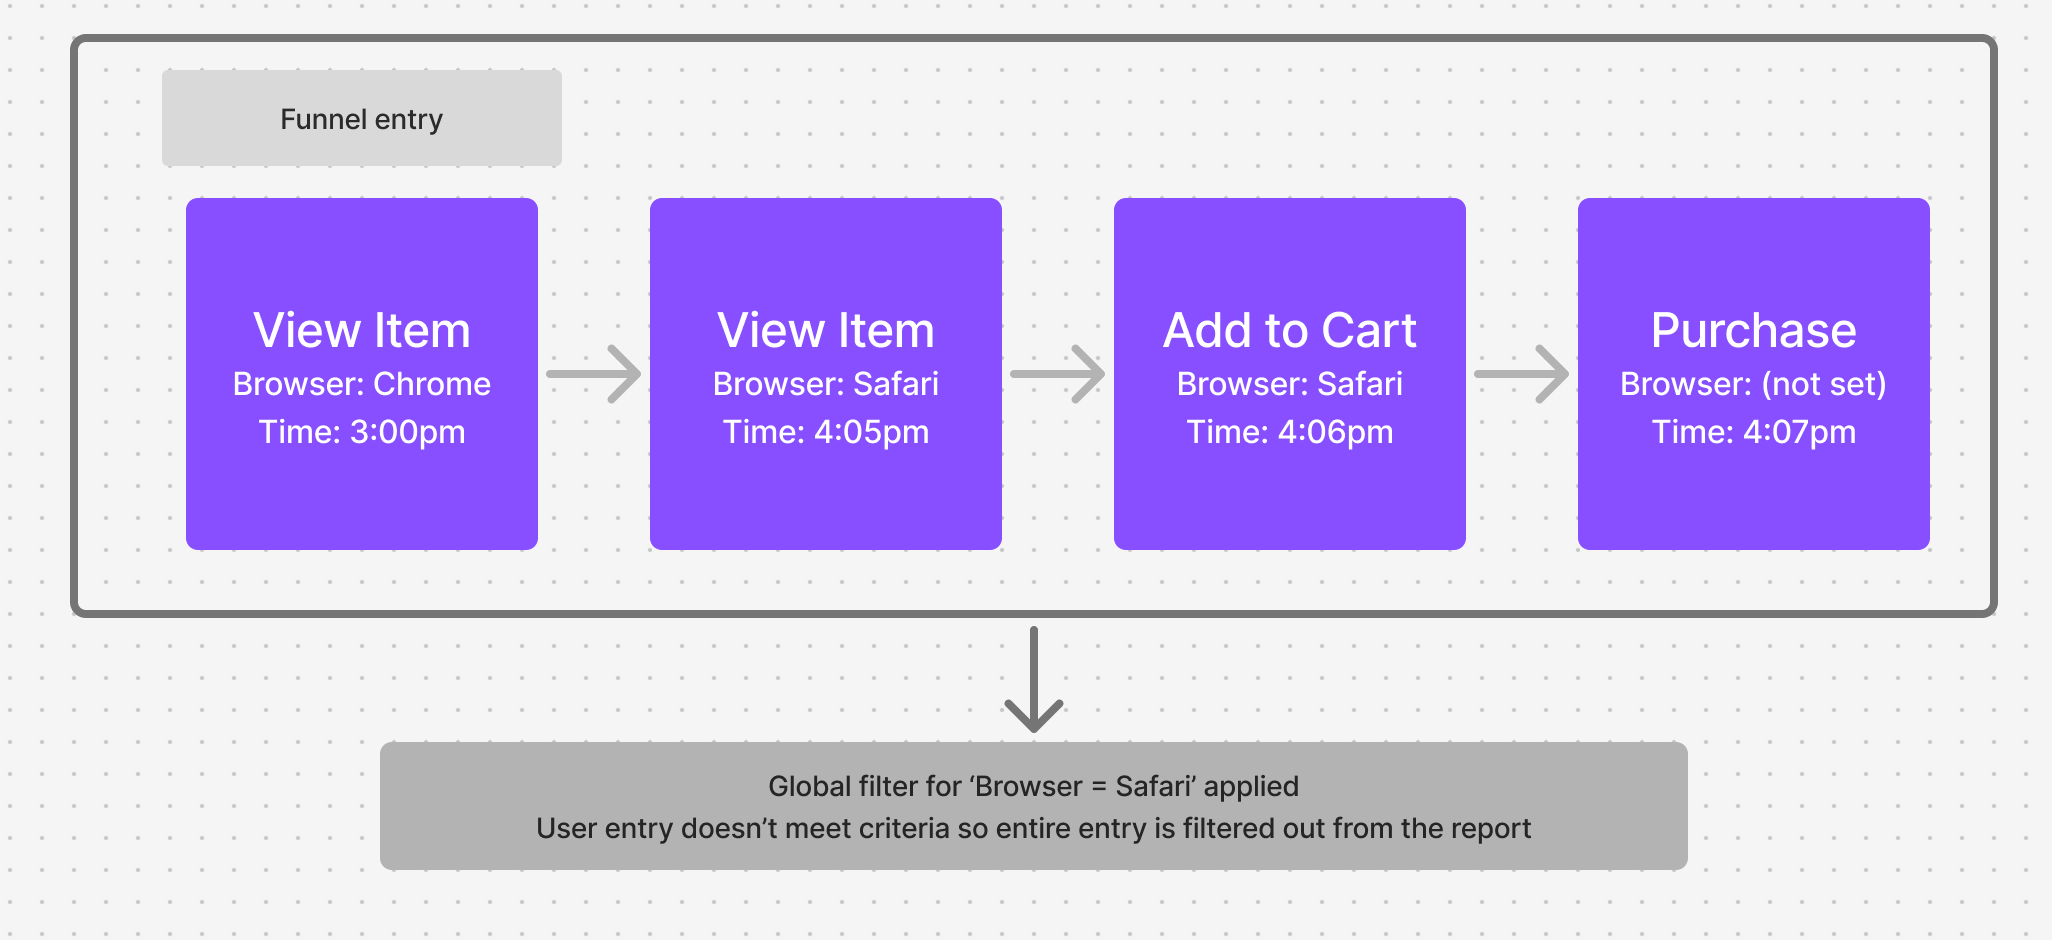
Property Attribution
First Step Defined vs Last Step Defined
Event property values can vary from step to step in your funnel. You can choose which step the value is derived from for breakdowns and filters. To access this feature, filter or breakdown by a property in the funnel chart below the query builder. Click on Step 1 to select either “Last Step Defined”, “First Step Defined”, or a specific step number. Your selected choice will determine which step of your funnel determines the property value for the whole funnel.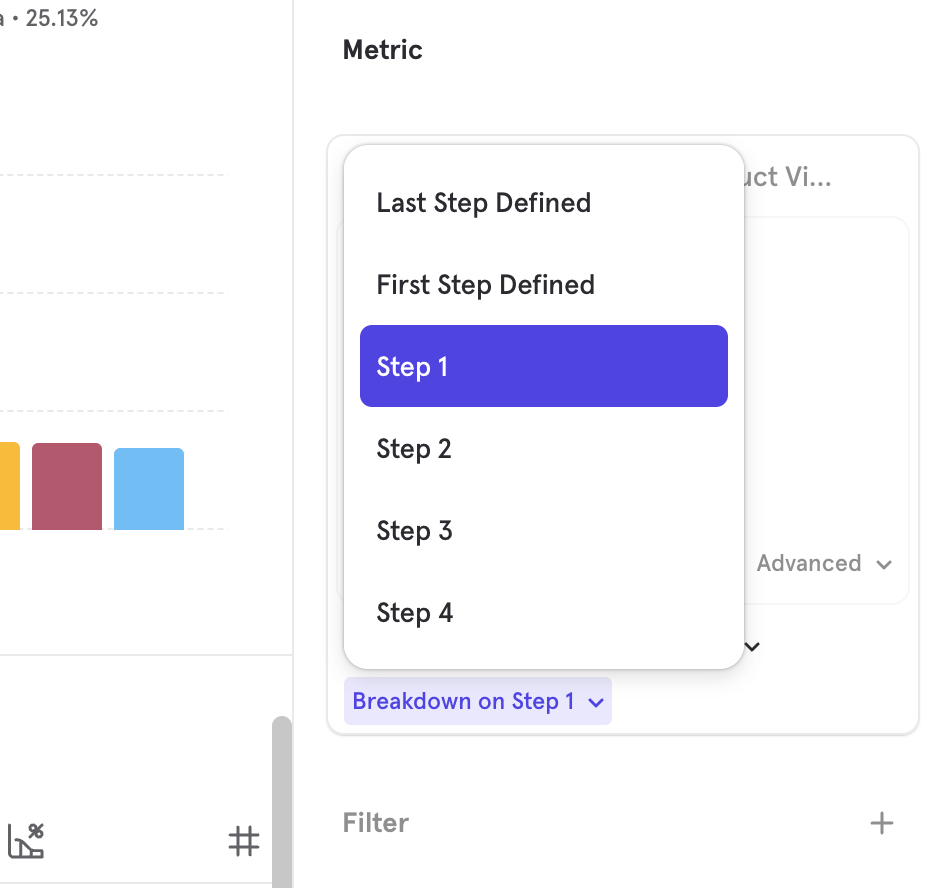
”First Step Defined” Attribution and Forwardfilling
By default, Mixpanel forward-fills event properties in instances where properties are sent in earlier steps of a Funnel but not sent in subsequent steps of the same funnel. This means that the property that is present in the early steps of a funnel is appended to the later steps of the funnel, where it was previously absent. Select First Step Defined to attribute the first property value to the whole funnel, regardless of whether the property value changes in subsequent steps. First Step Defined is not the same as the first step of the funnel; it is the first time the property is given a non-null defined value. For example, say that the user is shopping on your website and you want to track a funnel from Page View → View Item → Add to Cart → Checkout, with a breakdown on “color”. With “First Step Defined”, the first color will be applied to the entire funnel, in this case, “red” seen on View Item.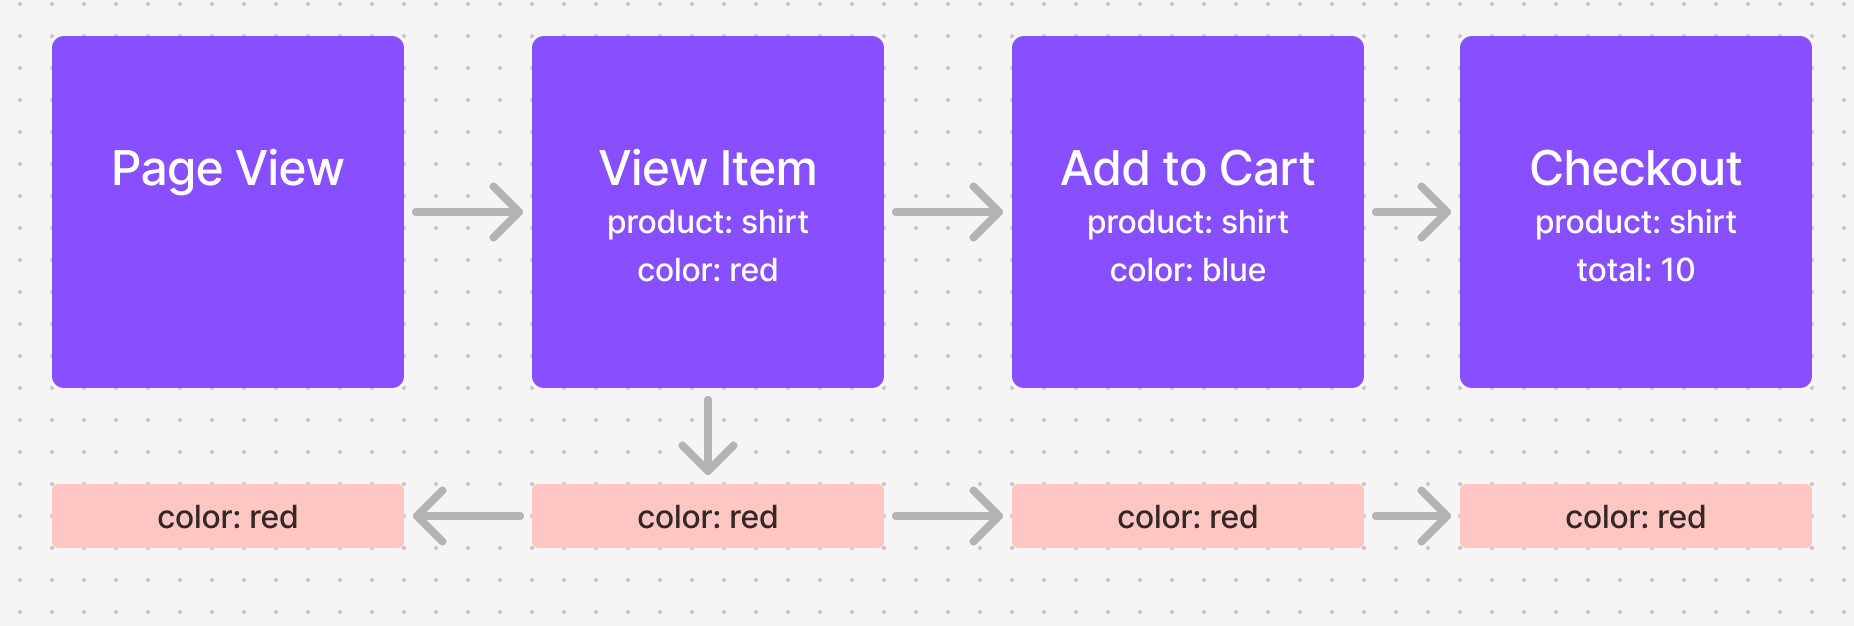
Last Step Defined Attribution
By default, Mixpanel “backfills” event properties in instances where properties are sent in later steps of a Funnel but not sent in the earlier steps of the same funnel. This means that the property that is present in later steps of a funnel is appended to the earlier steps of the funnel, where it was previously absent. Select Last Step Defined to attribute the last property value to the whole funnel, regardless of the property value in previous steps. Last Step Defined is not the same as the last step of the funnel; it is the last time the property is given a non-null defined value. For example, say that the user is shopping on your website and you want to track a funnel from Page View → View Item → Add to Cart → Checkout, with a breakdown on “color”. With “Last Step Defined”, the last defined color value will be applied to the entire funnel, in this case, “blue” seen on Add to Cart.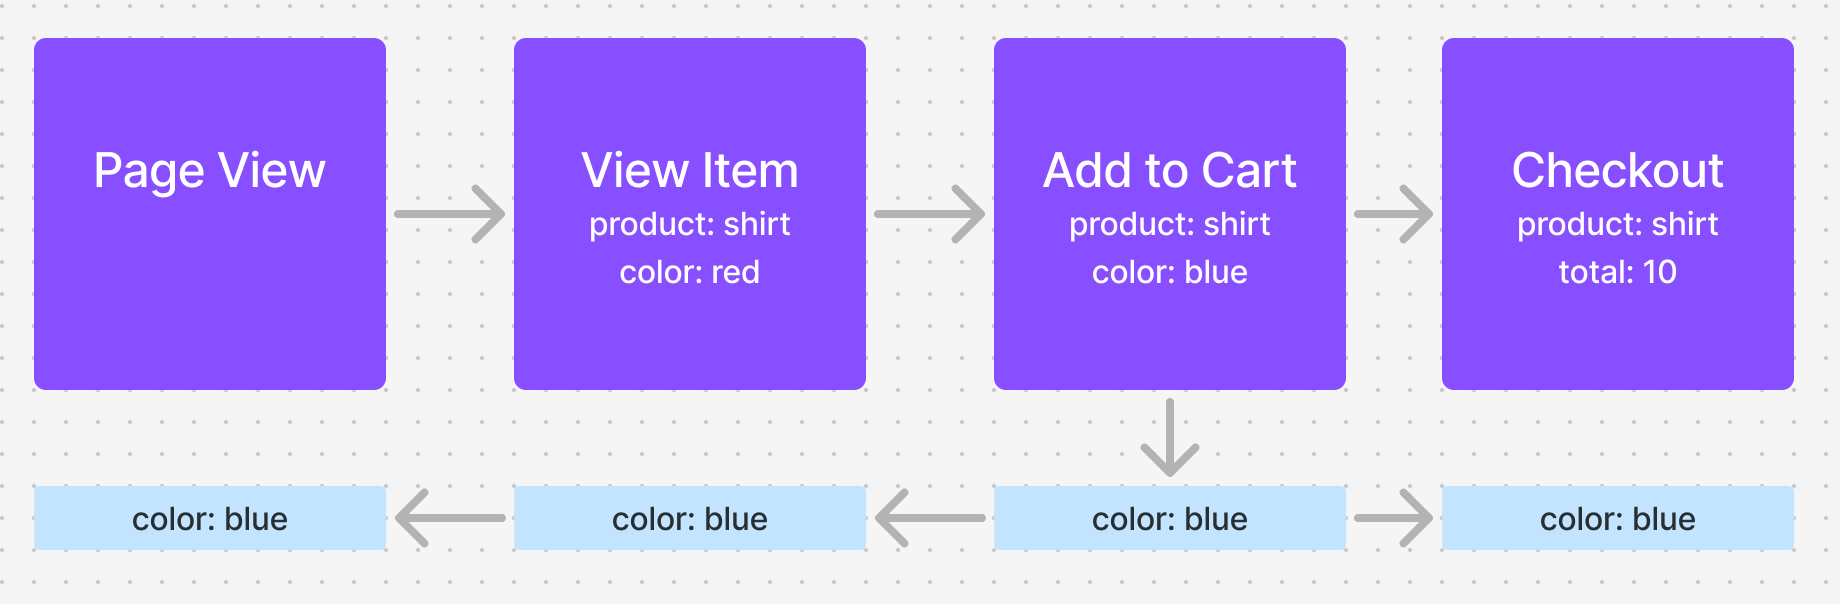
Per-Step Attribution
You can choose to attribute a property value from any step to the whole funnel by selecting the step number. Note that with this option, you may see an “undefined” null value for the property, as this option is not tied to when the property value was defined.View as Flow
You can click into any funnel step and select “View as Flow”. This takes you to the flows report and lets you see:- What events did users do before or after converting?
- What events did the users who dropped off do instead?
Rename a Step
Click on the “…” icon beside a step and click “Rename” to rename it.Next: Frequently Asked Questions
Still got questions? Get answers to the most frequently asked Funnels questions below.