Why is my user shown as dropped off even though they’ve just completed the full funnel today?
Assuming that the user performed all actions in the funnel, on their first try, in the right sequence, within the conversion window, the user should be counted as converted. However, there is an ID Merge delay where it can take up to 24 hours for the anonymous and identified user activity to be linked together across Mixpanel. If you are looking at the Funnel report for today, the events may not be linked to one user if they are soon after ingestion. Once the identities are merged, the funnel should display the conversion if the user performs the steps in the funnel in the specified sequence.Can users do other actions during the funnel?
Users can complete the steps you designate in your funnel in loose order. Loose order means that a customer can engage in other actions in between funnel steps, as long as they complete all the funnel steps in order. See the Ordering section for more information.Why do I get differing numbers when comparing Funnels and Insights?
Funnels and Insights are fundamentally different when it comes to counting events. A Funnels report expects users to convert through a series of events within a specified time period, with additional logic around re-entries and filtering. An Insight metric gives the actual count of users or events. For example, let’s say we are looking at a Funnel from Step 1 → Step 2. In the Funnel report, the user will need to enter the report at “Step 1” and then track “Step 2” within the conversion window. If they don’t do both of those things, “Step 2” will not be counted in the report. An Insight metric, on the other hand, will count the “Step 2” event without those criteria being met. In a “Totals” funnel, users will only re-enter after exiting their previous attempt. This means the count for “Step 1” in a funnel may not match the overall total number of events tracked for “Step 1”. As an example, let”s say a user tracked Step 1 → Step 1 → Step 2. This user would only enter the funnel once when they first track “Step 1”, but the “Total” count on an Insight report would show a count of 2 “Step 1” events.Can multiple events count towards the same Funnel step?
Custom events allow multiple events to count towards the same step in the funnel. With custom events, you can essentially “combine” events into a single event so that you can create Funnels that measure the following: Step 1: Event A OR Event B Step 2: Event C This allows users to make multiple paths to the same end goal. Learn more about creating custom events here.Why are there only 200 segments in my Funnels breakdown report?
When breaking down a Funnel by a Property, only the top 200 property values will be returned. All other segments will be grouped into an “$other” category. If you would like to view all of the individual segments beyond the 200-property limit, you can export a CSV of the report. The export will contain up to 10k segments.How does the Funnel handle simultaneous events?
Funnels include a built-in two-second grace period. This means any consecutive steps that have timestamps within two seconds of one another are interchangeable. This window allows for inconsistencies that arise with cross-platform tracking, batch event sending, mobile time tracking, or variations in connection speed. What does this mean in terms of your funnel? In a funnel with step A → B, if a user completes event B first and then performs event A within two seconds, the Funnel will count this as a conversion from A → B or B → A.What is the difference between Inline Filtering and Global Filtering?
You can use both inline and global filters to decide which users and events to include in a funnel. Inline filters apply pre-query to a specified step, while global filters apply post-query based on the property attribution selected. At a high level, an inline filter query will filter for the funnel entry for the user that meets the filter criteria. With a global filter, the user will enter the funnel the first time that they track Step 1. That entry will then be filtered based on the global filter criteria. See the Filters for more information.Why do the Line chart (by day) and Table (with a day breakdown) show different numbers for the same funnel?
The two visualizations calculate conversions differently. The Line chart runs a separate funnel for each day (based on the time interval) in your date range, so a user can enter the funnel on multiple days and be counted multiple times. The Table (with a day breakdown) runs a single funnel across the full date range, then segments the results by day afterward, so each user is only counted once.How does Mixpanel calculate statistical significance?
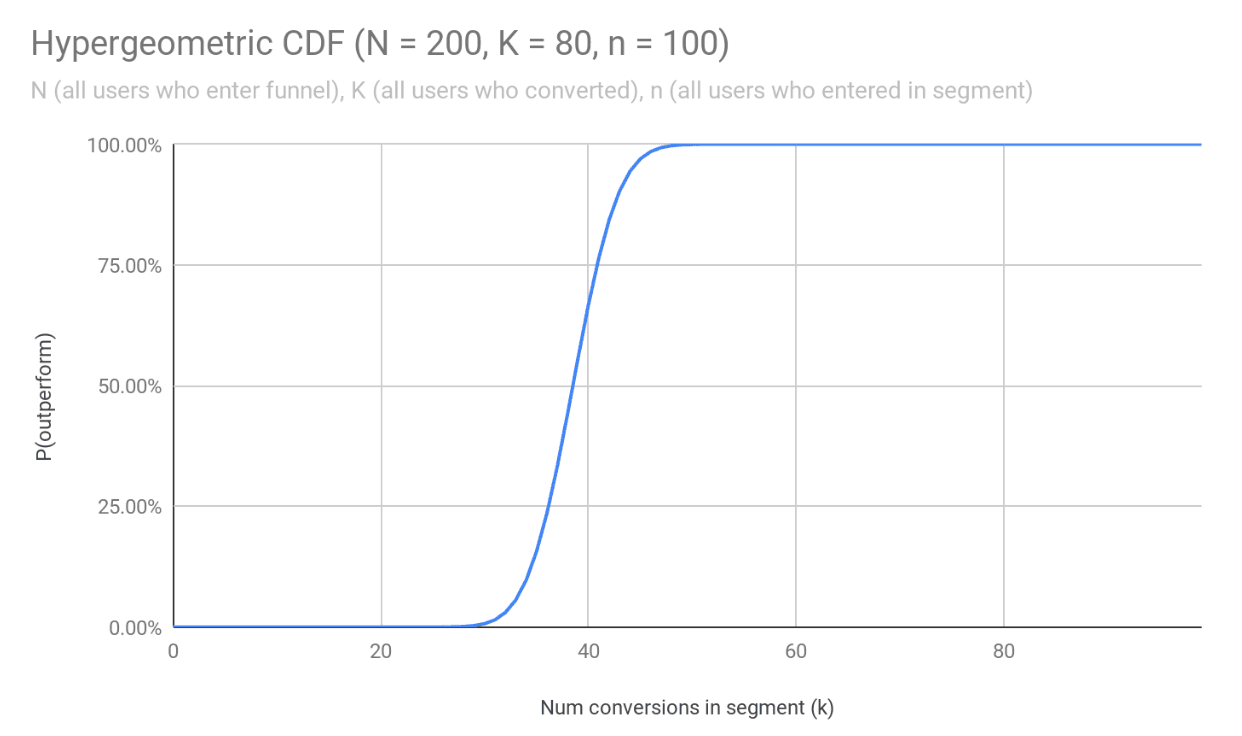
This section is intended for users who want to understand the mathematics involved in statistical significance in depth. To determine whether a particular segment’s conversion rate is significantly different from the overall conversion rate, we use a hypergeometric distribution to calculate statistical significance. The hypergeometric distribution is used to model the probability of picking k items of a particular type in n attempts without replacement from a population of size N having K items of the same type. For example, let’s say we have a sock drawer with 20 socks, 10 blue and 10 red. If we randomly picked 10 socks one at a time from the drawer without putting them back between picks, and we wanted to know the probability of 9 of those socks being red and 1 of them being blue, we would use a hypergeometric distribution to calculate that. This is applied to funnels by considering the total number of users who enter the funnel to be a finite population of size N, out of which a subset of users convert (K). We then estimate the probability of getting k conversions in a particular segment (given that there were n users who entered the funnel in that segment) if users in that particular segment were picked at random from the overall user set. The higher the probability, the higher the likelihood that variations we see in conversion rate are due to random chance. To calculate the actual p-value, we estimate the hypergeometric cumulative distribution function (CDF) for N, K, n.