Use Cases
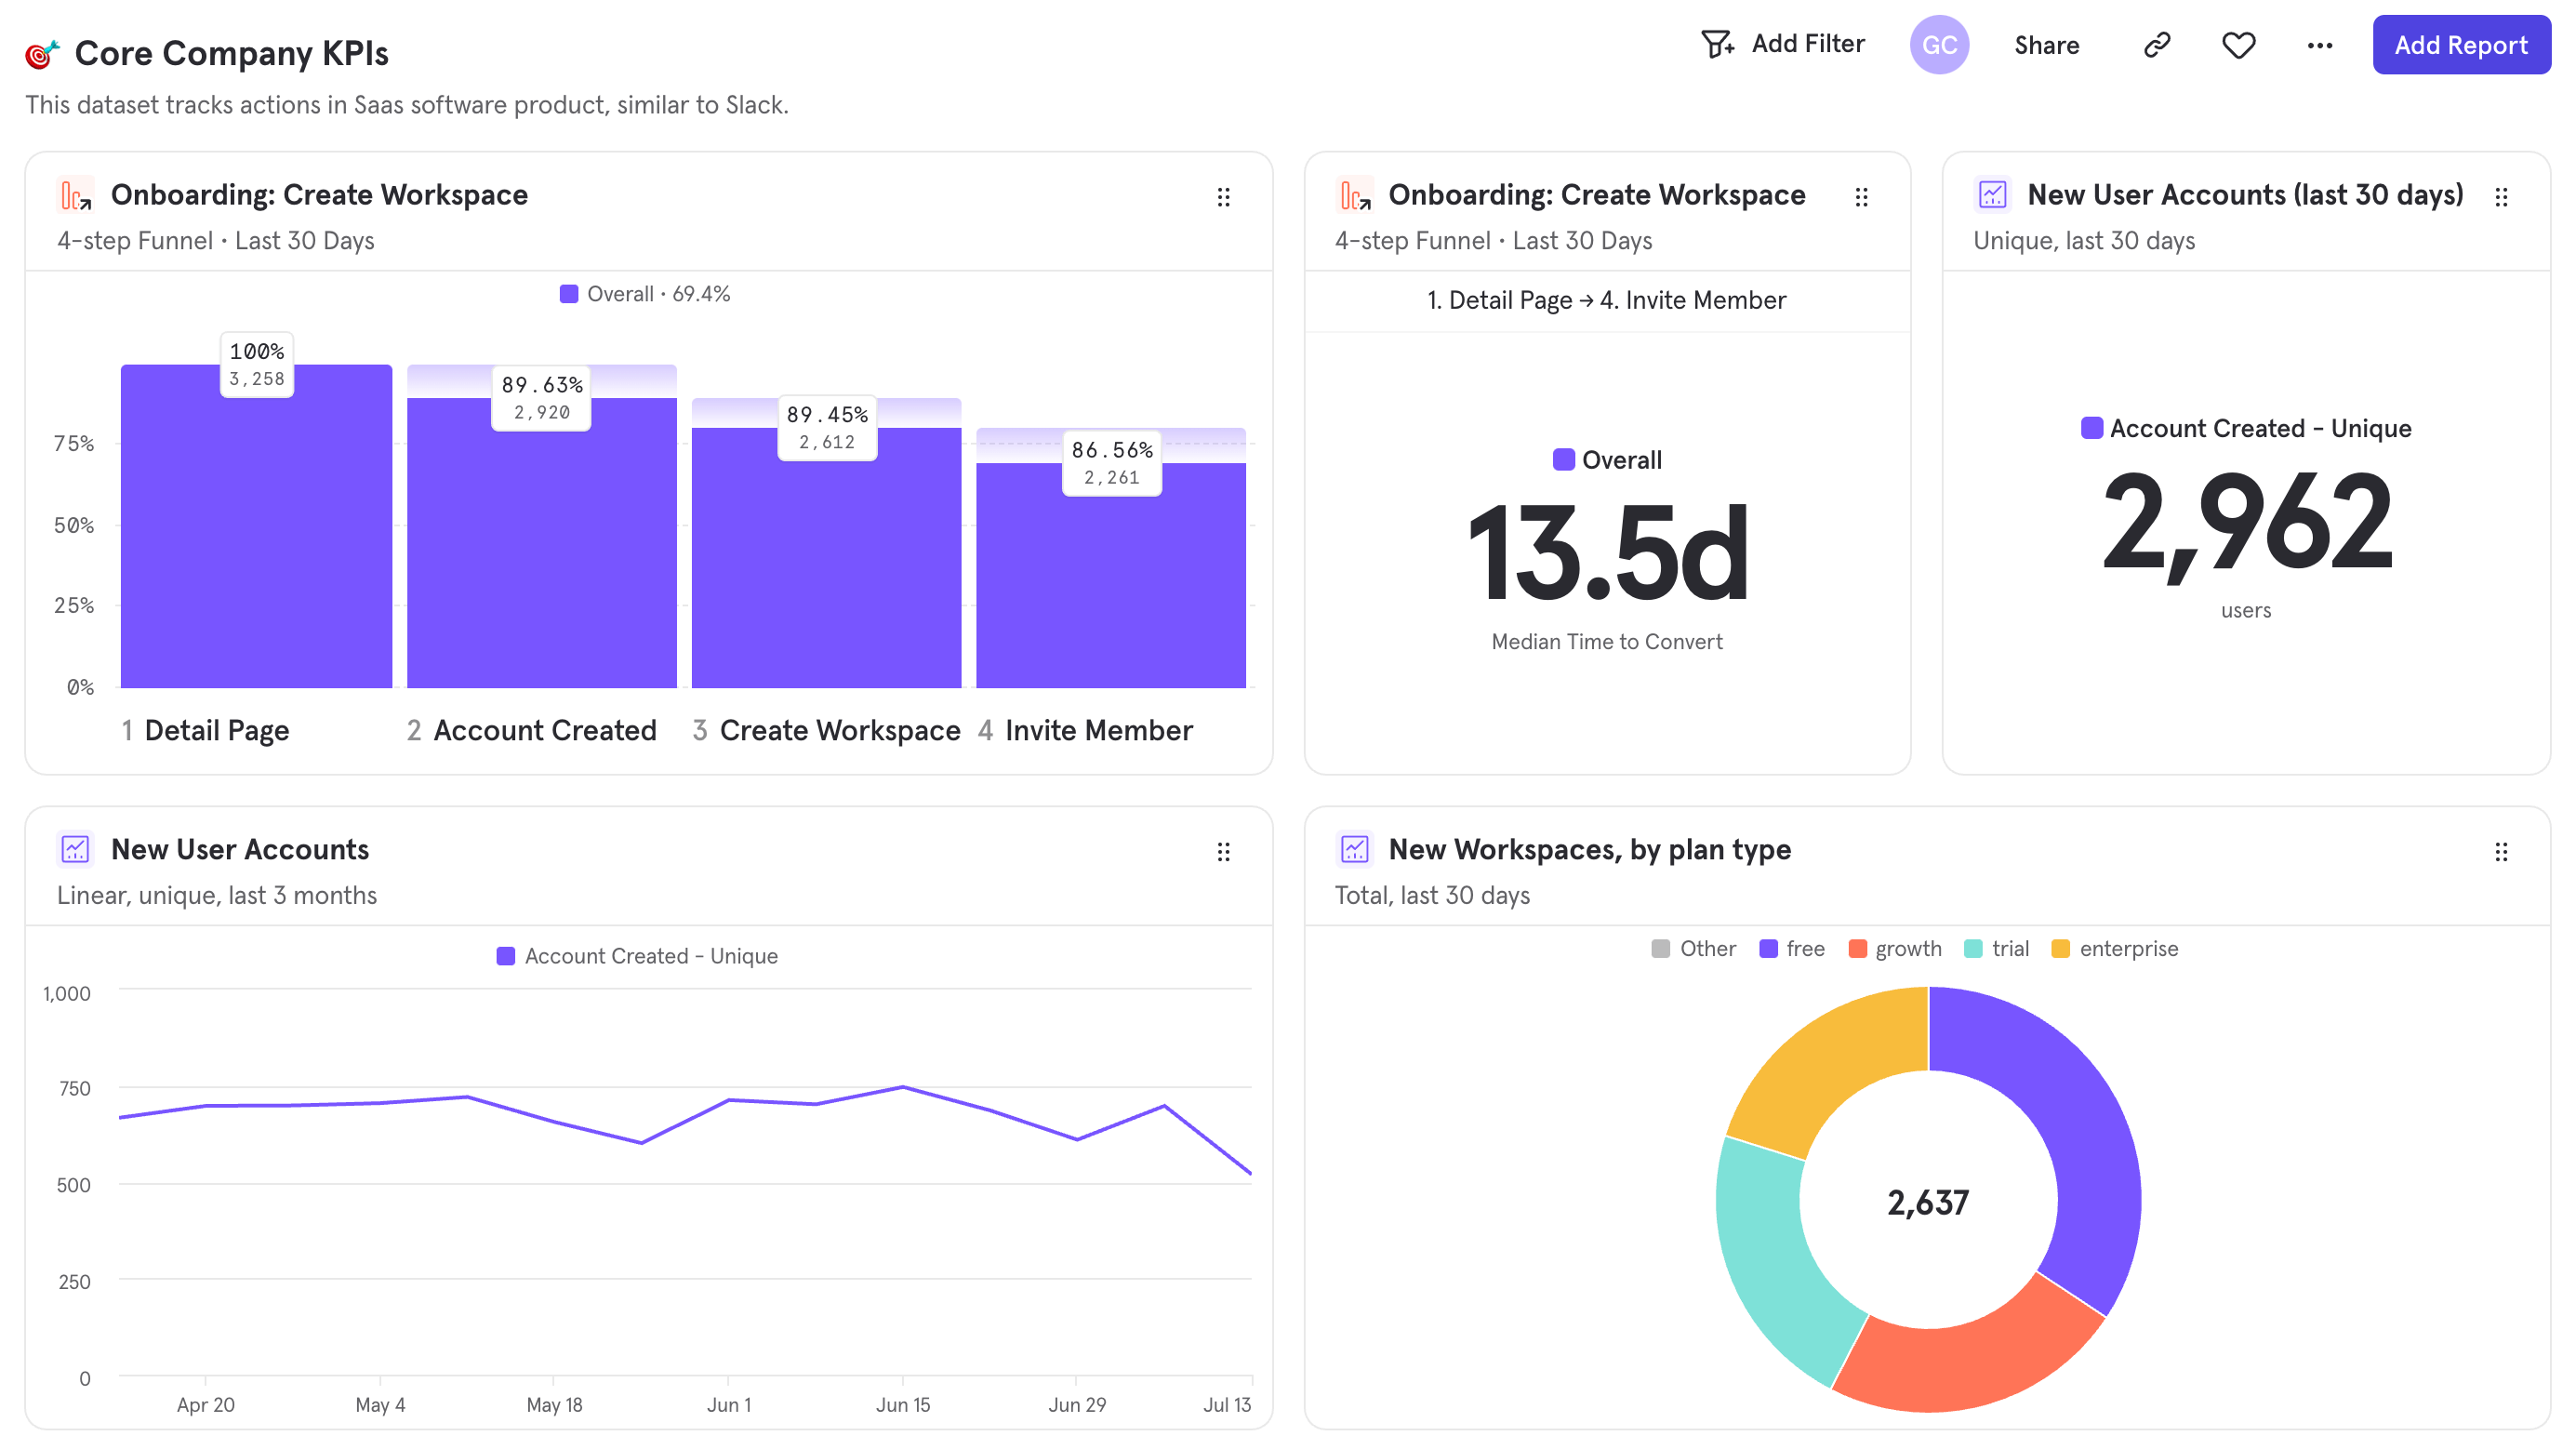
Boards can be used to keep your whole company on top of your KPIs. Additionally, you can add text to your boards to help tell a compelling story, or highlight specific interpretations of the other reports on boards. Create personal boards or project boards and share them with your team to help you and your colleagues understand and stay on top of your metrics.Quick Start
Step 1: Navigating Boards
Before creating a board of your own, it’s best to explore existing boards within your Mixpanel project. There’s a good chance that someone has already created a board that may be of interest to you. The best way to navigate to existing boards within your Mixpanel project is the directory on the left-hand side of the page. This directory makes it easy to access your most-used boards by organizing them into several sections: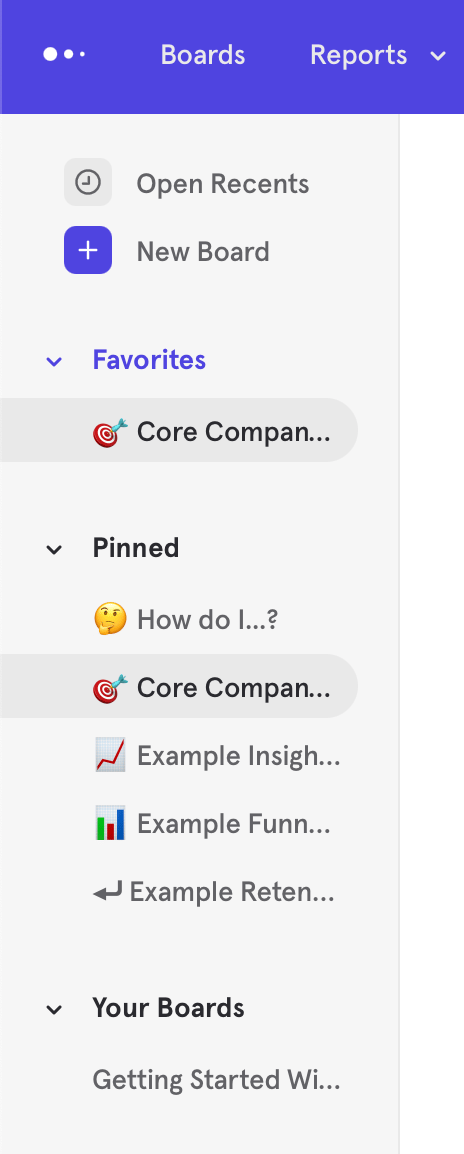
Step 2: Creating a new Board
Once you’ve decided that you want to create a board of your own, on the Boards page, click ”+ New Board” at the top of the left side directory. The new untitled board will be created immediately, but you may wish to give it a name. To do so, click the current title, then type the desired name. At this point, your empty board will look like this: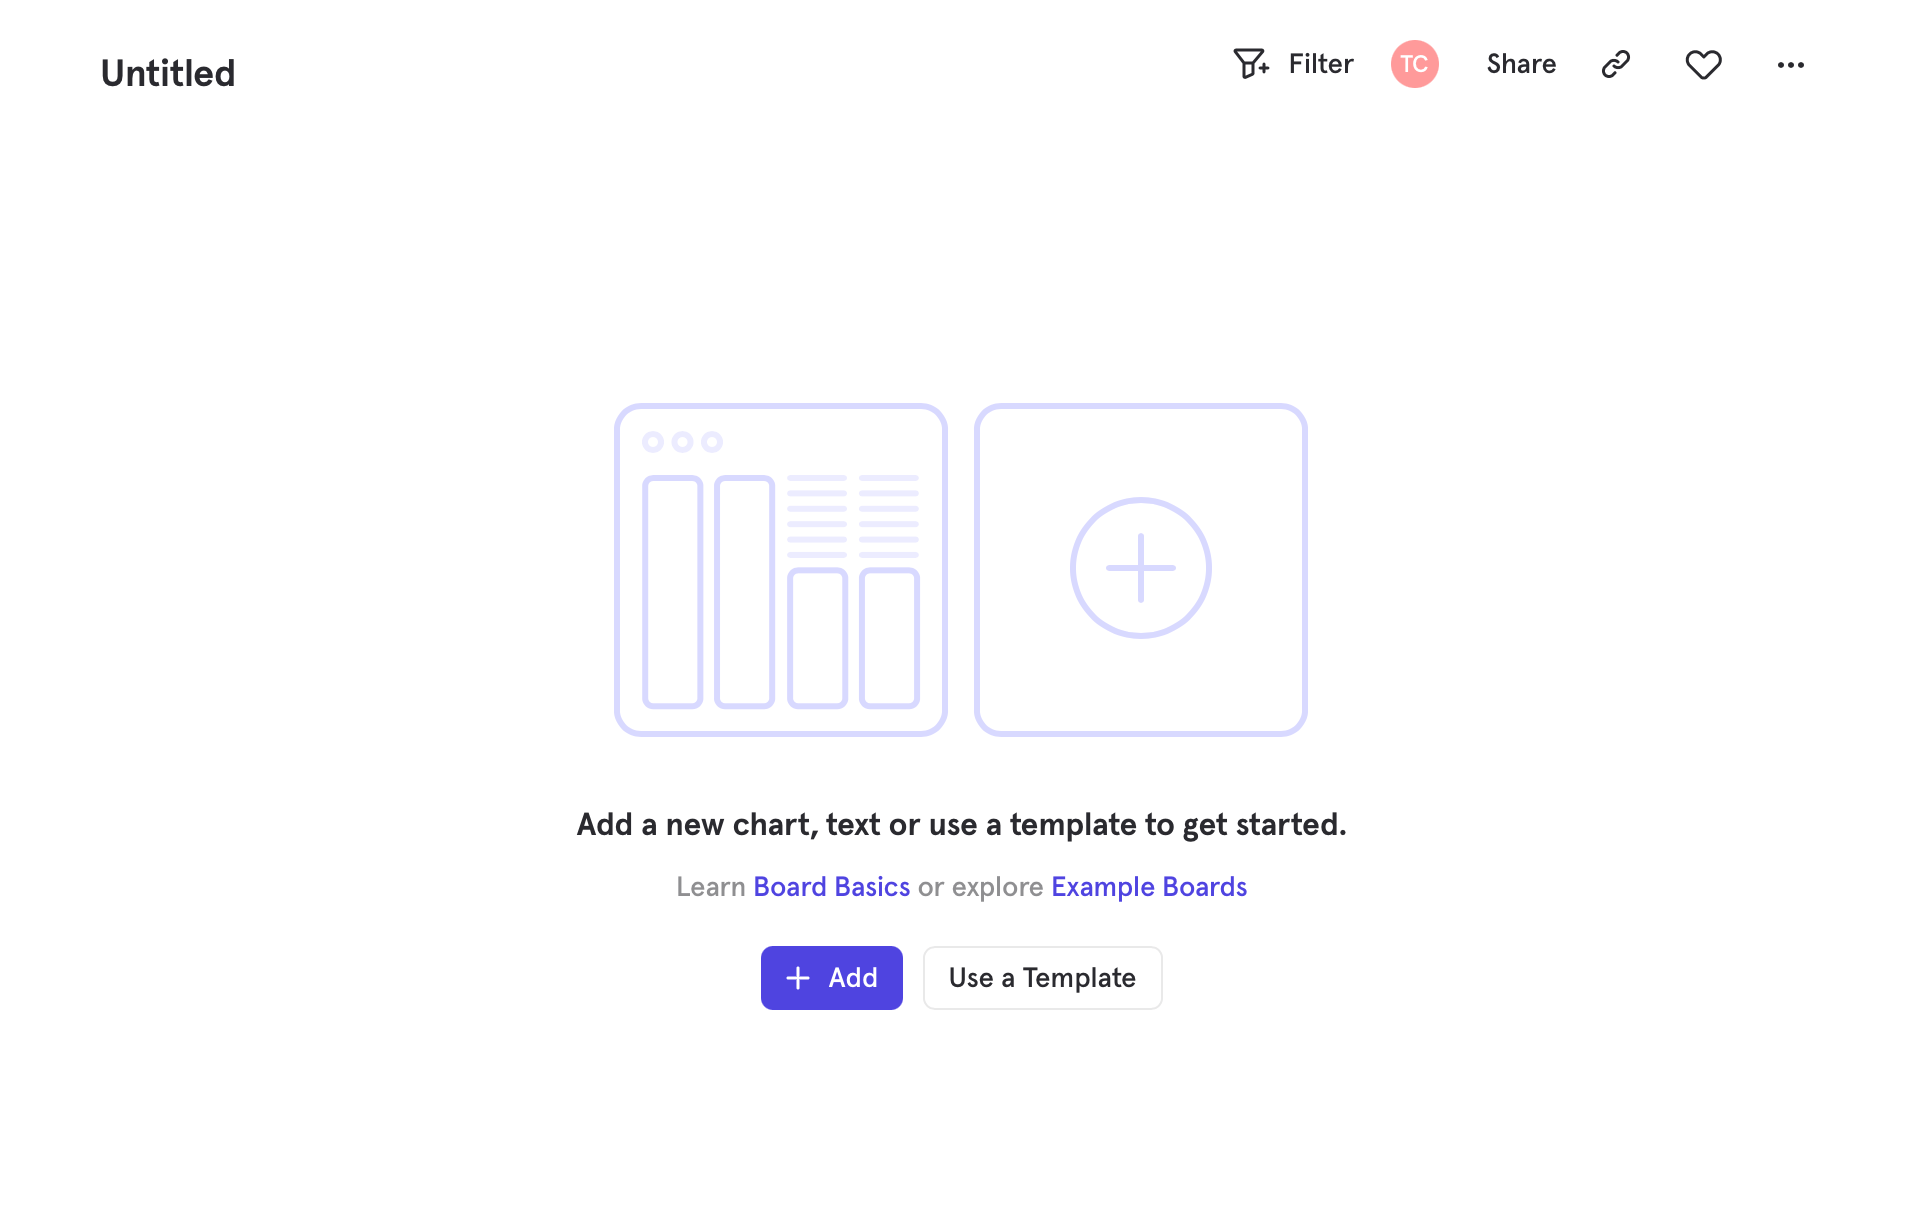
Step 3: Adding content to Boards
There are 3 types of content that you can add to a board:- An existing report that has already been created
- A new report that you can make from Insights, Funnels, Flows or Retention
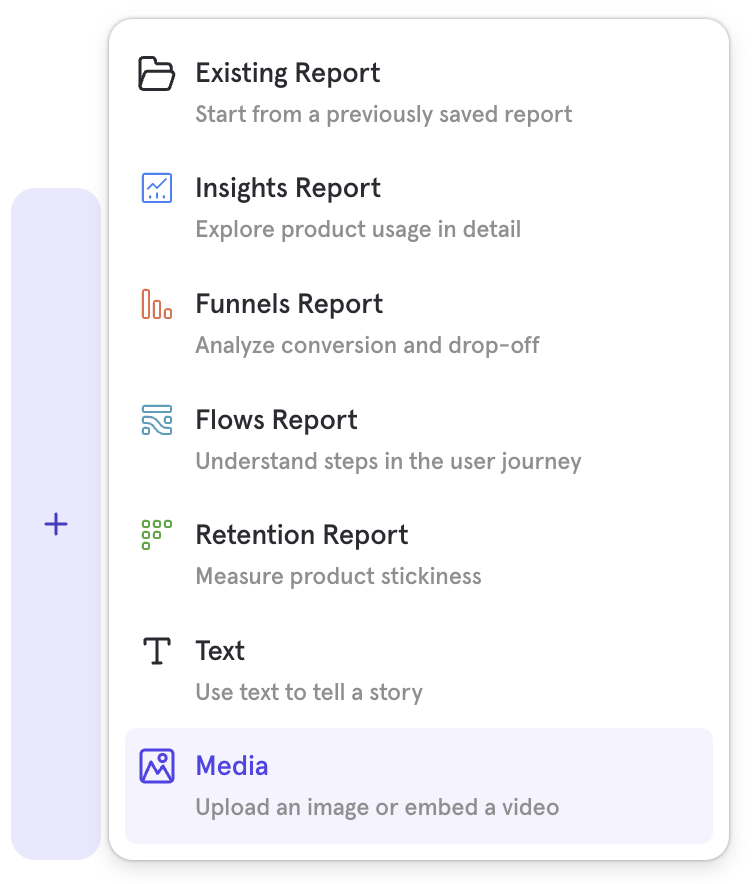
- A text or media card to give context to your board
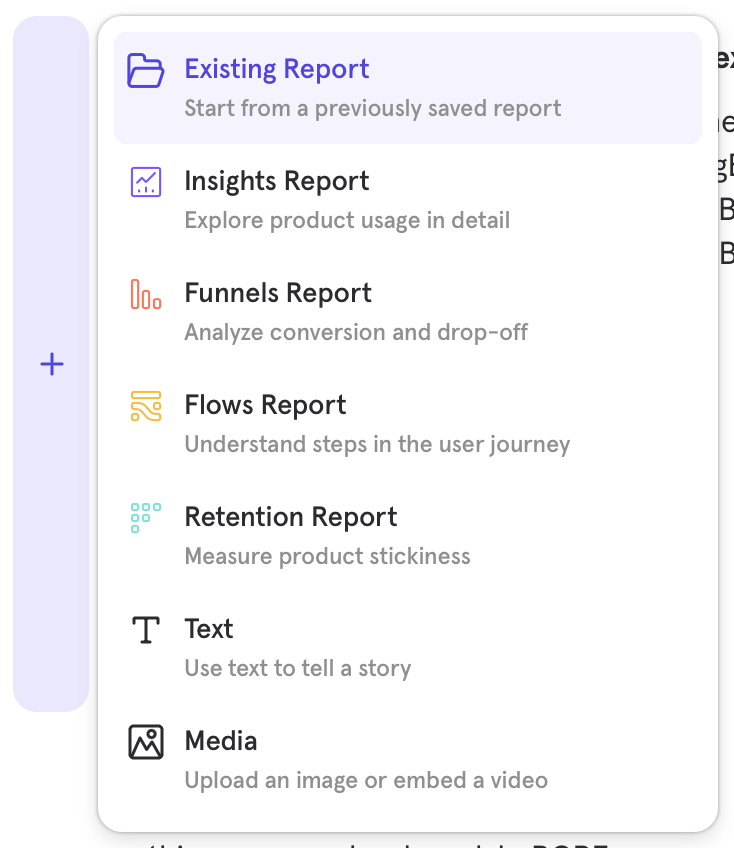
- Starting from a board, adding a report can be done via the “Add” button near the top right of the board, or if the board is empty, from the center of the page. This will open a popup from which you can choose to create a new report of any type or add an existing report.
- Starting from an existing report, adding the report to a board can be done via the board breadcrumb dropdown at the top left of the report, next to the report’s title. Click into the dropdown, then select “Add to another Board.” Choose your board, and a copy of the report will be added to it.
- Starting from another board, select the overflow menu of a report you’d like to add. Select “Make a Copy” and then choose the board you would like to add it to.
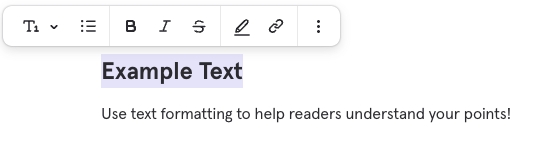
- Font size (title, subtitle, text)
- List type (bullets or ordered)
- Bold, Highlight, Italic, Strikethrough, Underline
- Quote block
- Hyperlinks
- Dividers
- Vimeo’s Video Privacy Explain
- Share videos with unlisted links with Vimeo
- Change video privacy settings on YouTube
- How to use Loom’s privacy settings
Step 4: Arrange Board Content
A Row-Based System
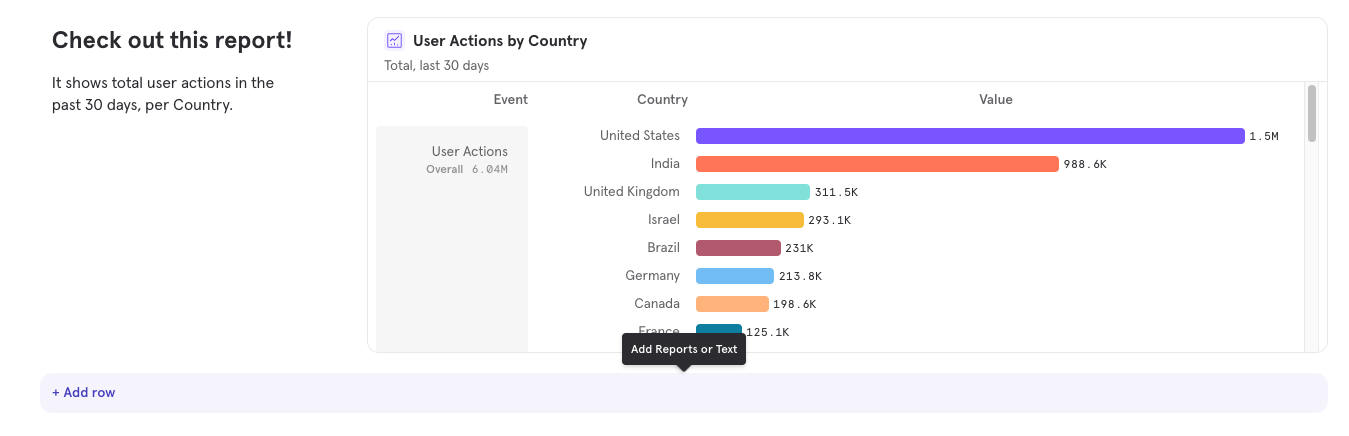
Content is arranged within rows. To add a card (either a report or text) to a row, click the ”+” button that appears on the left of a row when you hover over that row.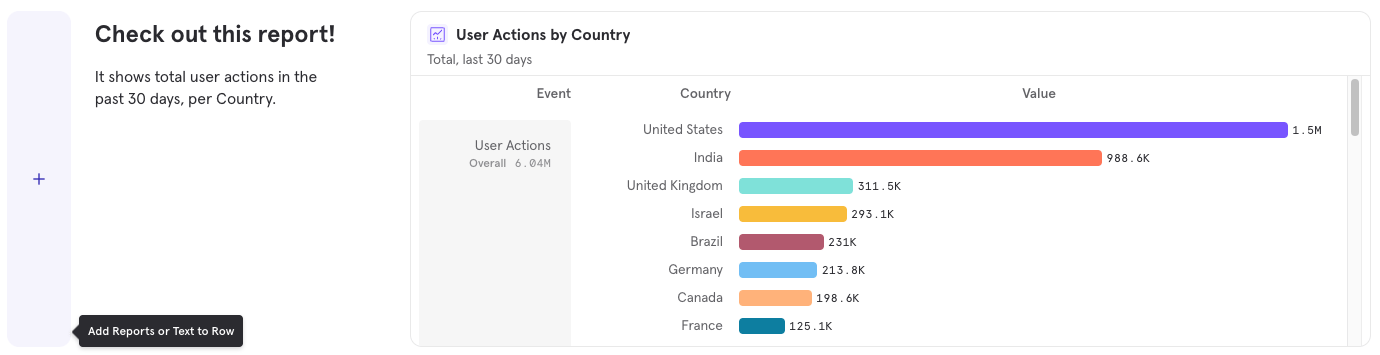
Moving Cards
To change the order of reports, simply click and drag any report to your desired position, via the gripper icon at the top right of the report.Resizing Cards
Cards on a row will automatically expand to fill the width of that row, but once two or more cards are on the row, you can adjust each card’s width by clicking and dragging the control between any two cards. Hover between the cards to surface the drag control.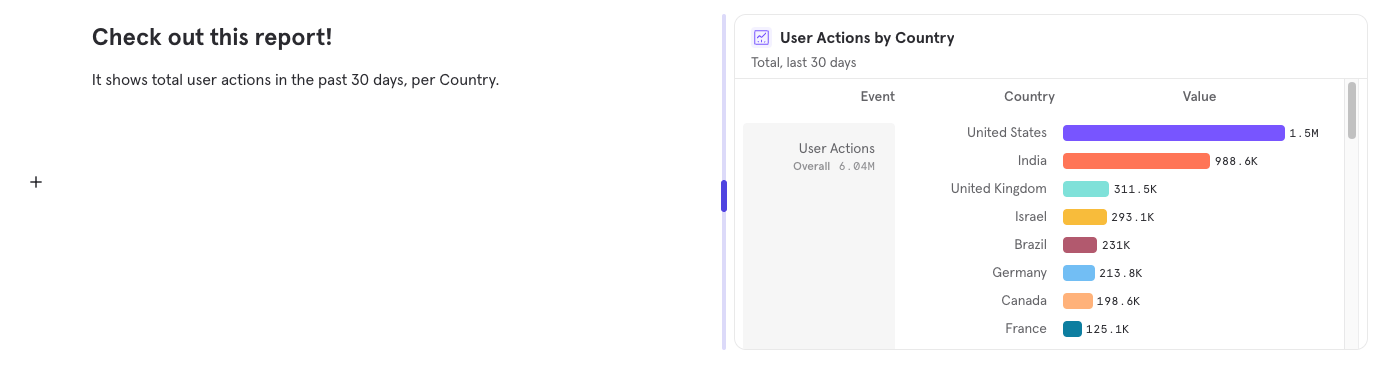
Resizing Rows
Row heights can now be adjusted to either show more report content, or hide empty space. To vertically resize a row, click and drag the control under that row. Hover under the row to surface the control.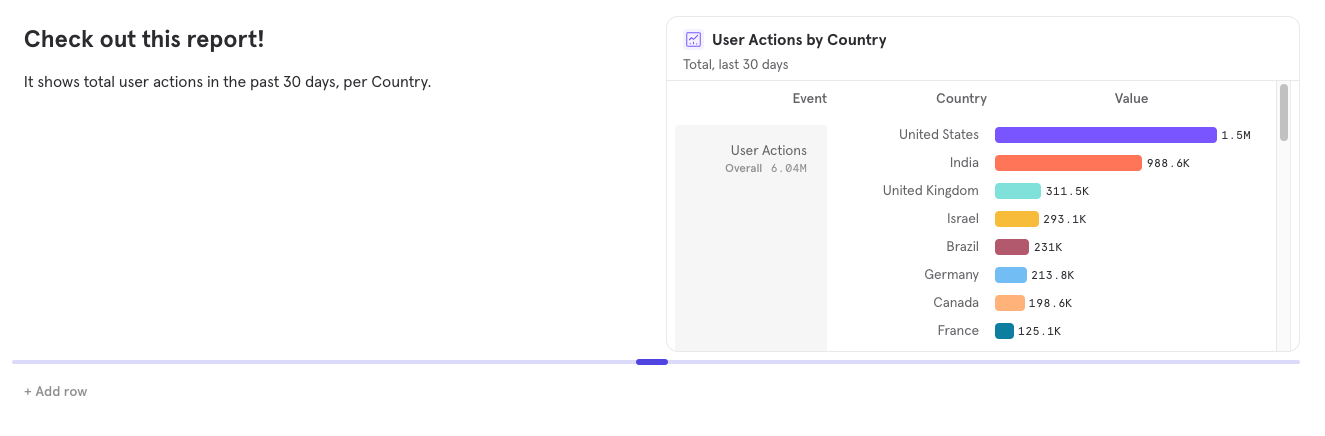
Step 5: Board-wide Date Ranges and Filters
Boards allow you to alter some aspects of the queries within each of the reports on that board, making it simple to ensure every report is showing results from a consistent set of data. Both date ranges and filters can be added by clicking “Add Filter” at the top right of the board.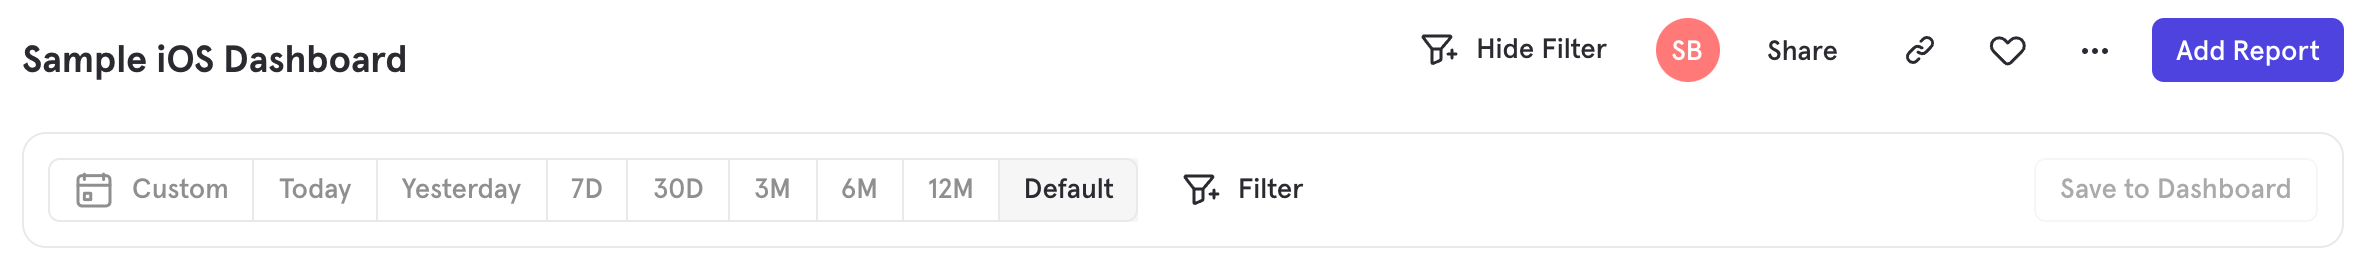
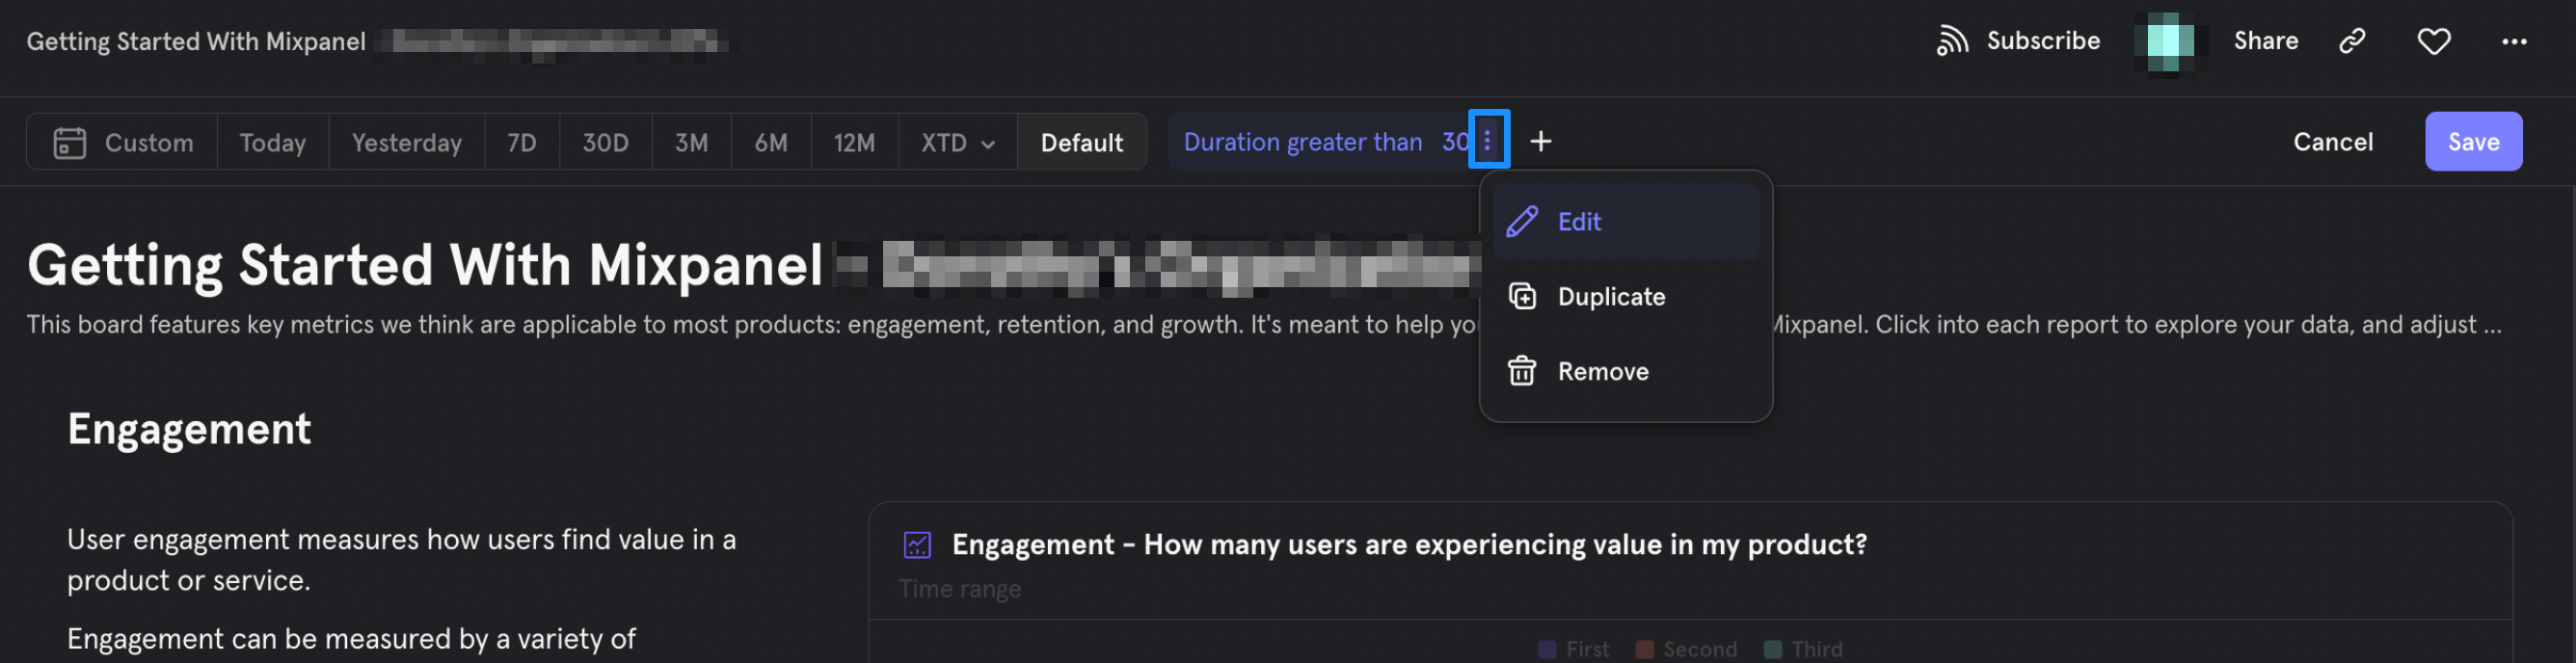
Board Dates
“Default” means each report uses its own saved date range. Choosing any other date range at the Board level sets all reports on that Board to use the same date. Use “Default” when you want reports to show different time windows (e.g., one report showing last 30 days, another showing last 60 days). Set a specific Board-level date range when you want all reports to use the same timeframe, such as from a product launch date.Board Subscriptions
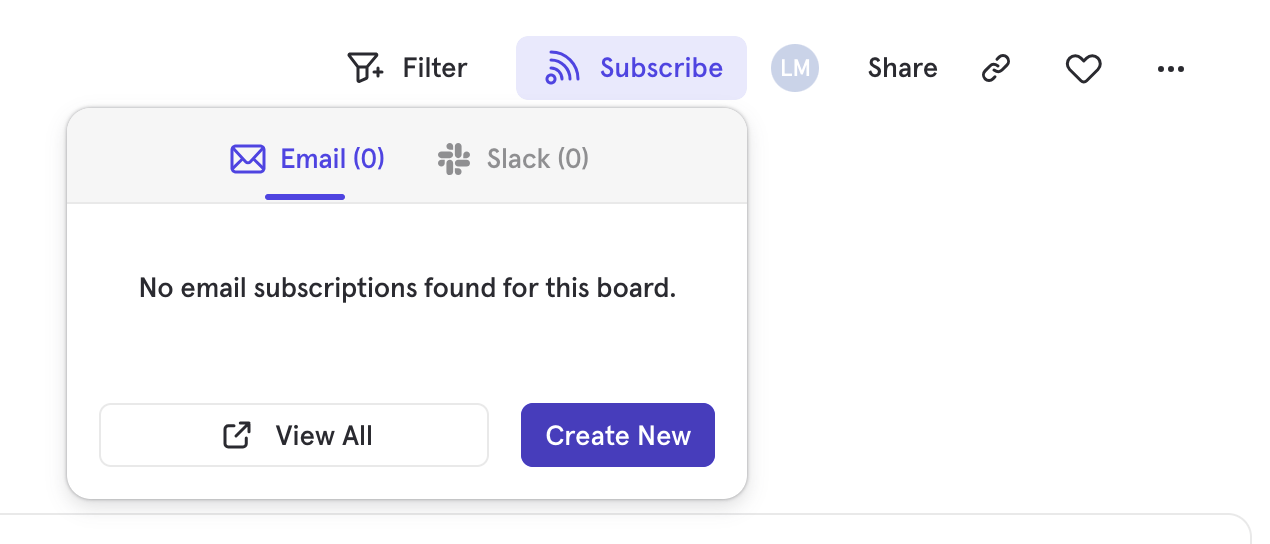
Board Subscriptions allow you to receive a snapshot of a board sent as an email or a slack message. Subscriptions allow members to share recent data with both project members and external audiences, providing quick and meaningful insight into a Mixpanel project. You must be a Project Owner, Admin, or Analyst to create a subscription. Subscriptions will send the board on a recurring schedule. You can choose a daily, weekly or monthly interval. Note that subscriptions only show the 8 reports that are on the top of a board. To create a Subscription:- Select Subscribe from the header at the top right of the board. You can see a list of existing subscriptions for the board here as well. Select “Create New”.
- Fill out the resulting form, selecting the desired email recipients or Slack channel, as well as the sending frequency (daily, weekly, or monthly).
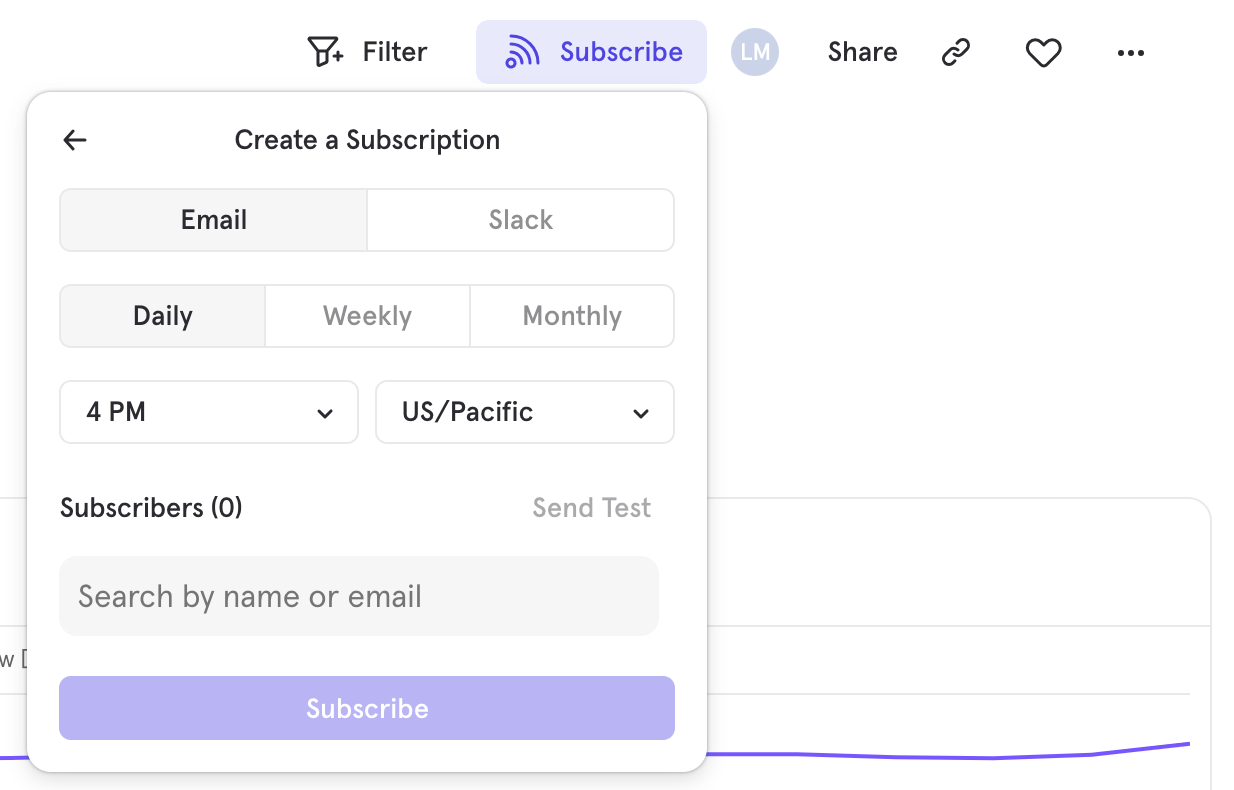
- Any email address will receive the email, whether or not they are internal or external to your organization
- Private Slack Channels are not available at this time
- Click “Subscribe”.
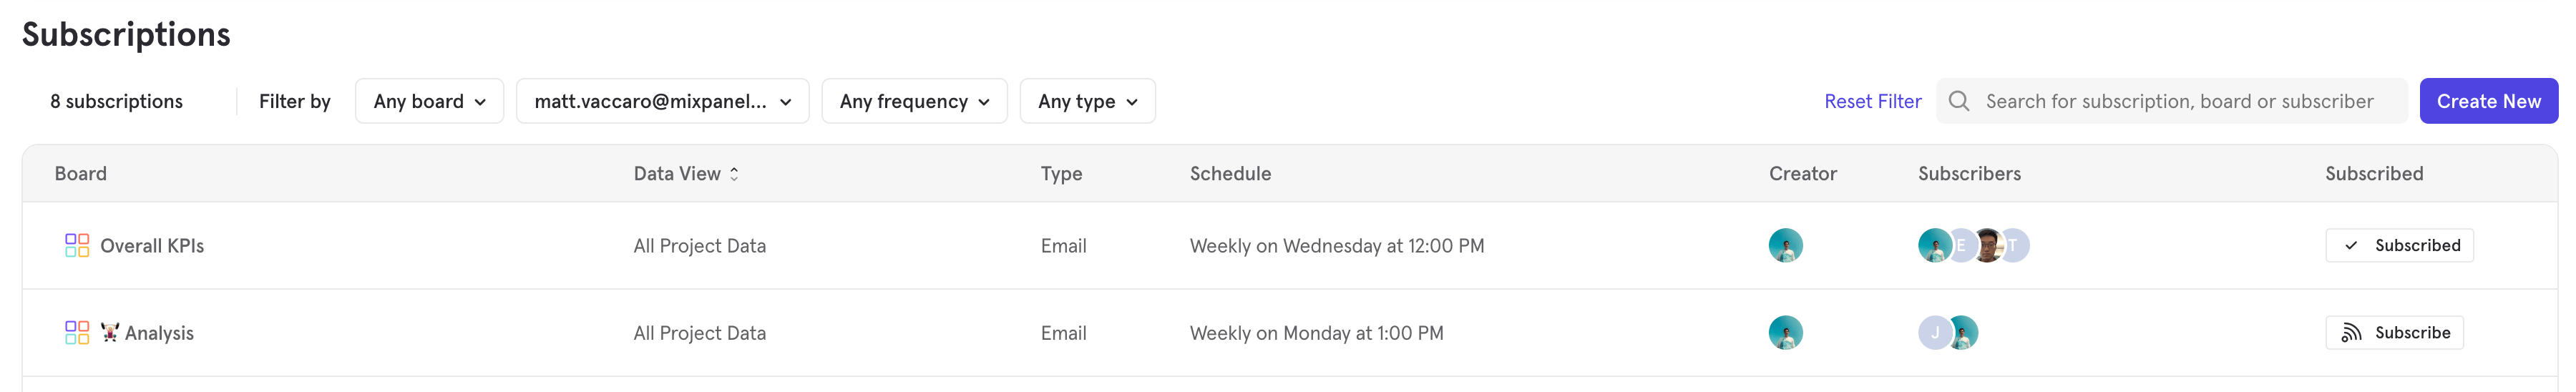
Seeing All Subscriptions
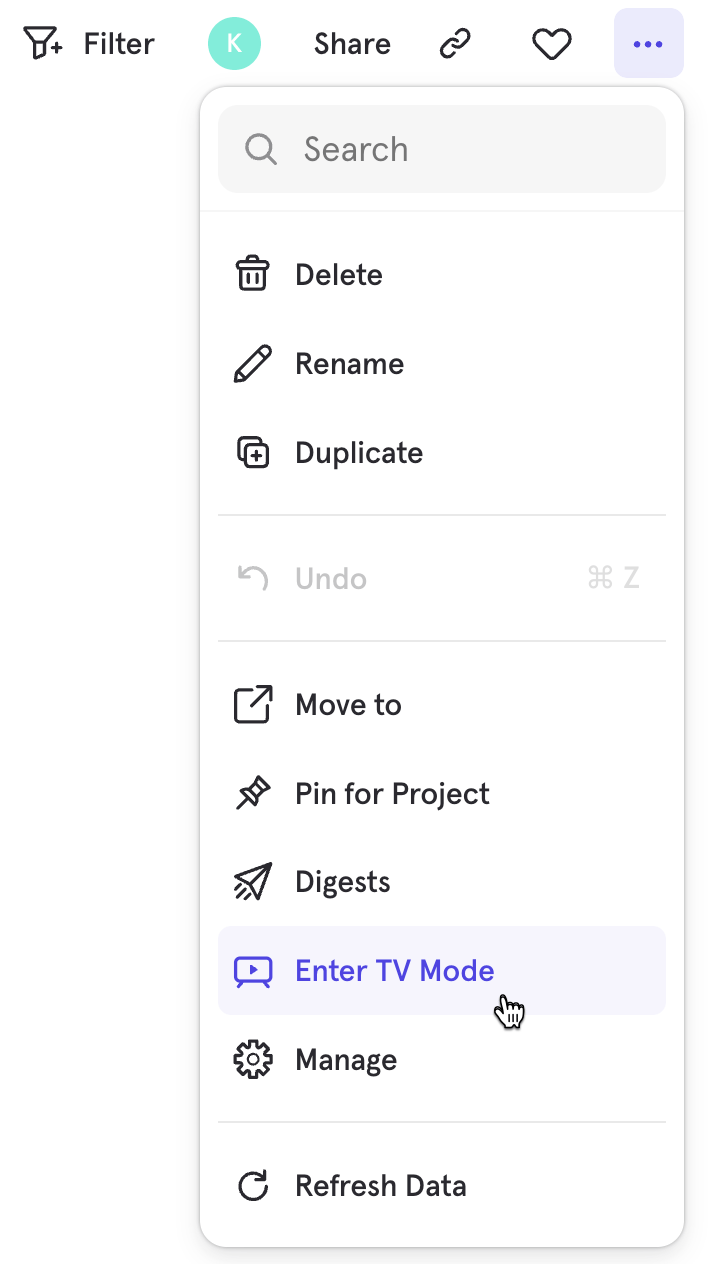
TV Mode
The Enter TV Mode option enables displaying a Board on a big screen (such as a TV in the office) where top-level company metrics / KPIs can be constantly monitored. The Board will auto-refresh every 10 minutes when in TV mode.